Maths on the tube
Tube travellers may have noticed some of the striking mathematical posters that were designed at the Newton Institute for display month-by-month during World Mathematical Year 2000 in trains of the London Underground. Actually, the chance of spotting one in a single tube journey was about one in a hundred, so if you did see one, you could truly say "This was my lucky day".
The posters were designed to provide a glimpse of a wide range of applications of mathematics in such fields as pattern formation, hurricane dynamics, solar physics, network theory, coding theory, molecular biology, wave mechanics, and so on. They can be seen together with information on how you can obtain a set of posters at the Newton Institute website. The project was funded by EPSRC (Engineering and Physical Sciences Research Council) who distributed 6000 sets to UK school. Many sets have also been distributed in the Far East by World Scientific who undertook a printing of 1000 sets free of charge.
Viewers of the TV soap Dawson's Creek (and there are some five million of these in USA and UK) may have noticed the posters which were used as backdrop in the classroom scenes of one or two of the episodes during April/May this year! In March 2001 the posters won a Merit level Heist award for excellence in an educational marketing campaign. The awards are issued annually to institutions from all over the UK in both further and higher education institutions.
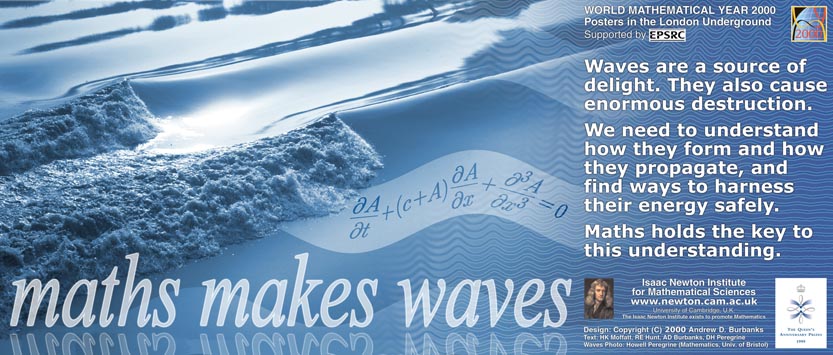
Each poster has a snappy title, sometimes a double entendre: Maths counts, maths stirs, maths is cool, maths hots up, maths is vital, maths makes waves and so on. Each poster also has a colourful image, and some carefully worded text designed to be comprehended during the trip between two tube stations (about five minutes) - no more! Finally, each poster incorporates a hint of the serious mathematics that lurks beneath the surface, e.g. the Korteweg-de Vries equation can be spotted by an eagle eye on the Maths Makes Waves poster.
The individual posters acknowledge the support of EPSRC, and the input of many colleagues from a number of Universities (Bristol, Bath, Exeter, Leeds, East Anglia as well as Cambridge), and from a number of other organisations (e.g. British Antarctic Survey). Particular thanks are due to Robert Hunt who participated in developing the various concepts, and to Andy Burbanks, whose eye for design and brilliant use of colour graphics was vital to the success of the project.
In this article we look at three of the posters in detail: Maths Counts, Maths Stirs, and Maths Predicts.
January 2000: Maths Counts
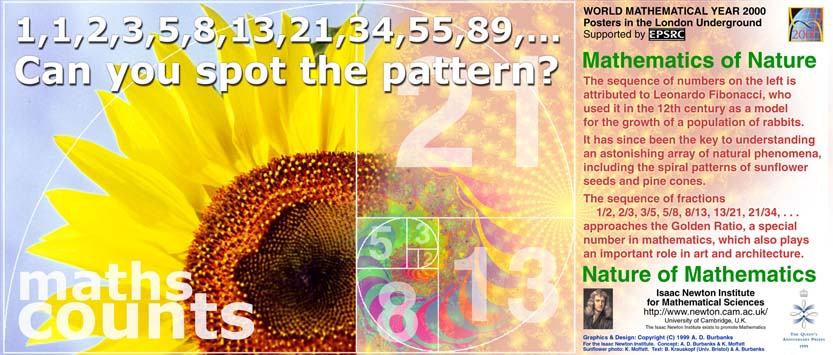
So, did you spot the pattern? To get the next number in the sequence you add together the previous two. We need two numbers to start the sequence off, and in the case of the Fibonacci sequence we start with 1 and 1.
Leonardo Fibonacci was born in Pisa in the 12th century. He was a merchant and customs officer of the time, travelling widely in North Africa. He was also one of the first Europeans to learn about the Arabic numbers 0, 1, 2, 3, 4, 5, 6, 7, 8 and 9 and to persuade other people to use them; before then everybody counted in 12's.
Leonardo was trying to find a way of modelling the population of rabbits. Let us suppose that any new pair of rabbits produces one pair in the next breeding season and one in the season after that, and then they die. This means that the total number of new pairs in a given season is equal to the number of new pairs born in the previous season, plus the number born in the season before that. So to find the next number in the sequence you add together the last number and the one before it. Starting with one pair of rabbits, you can easily generate the sequence 1, 1, 2, 3, 5, 8, 13, 21, 34, 55, 89, ... - the population of rabbits grows very quickly - actually exponentially fast!
The surprising thing about Fibonacci's sequence is that it turns out to occur in many different places in nature. The way in which the spiral patterns of sunflower seeds and pine cones grow is described by the sequence, and it is common for the number of petals on a flower to be a Fibonacci number. Four-leaved clovers are rarer than five-leaved ones because five is in Fibonacci's sequence and four isn't!
If you take the ratios of successive Fibonacci numbers - 1/2, 2/3, 3/5,5/8, 8/13, 13/21, 21/34, and so on - the fractions get closer and closer to the Golden Ratio (or Golden Section), ![]() , which is about 0.61803.... To be precise,
, which is about 0.61803.... To be precise,
![]() .
.
The Golden Ratio is a very special number, and has been known about since Greek times. Paintings with a height to width ratio of  have an especially aesthetically pleasing aspect. The Parthenon in Athens has the same ratio of lengths. The five-pointed stars on many flags of the world (for example, the European flag) are made by cutting the
diagonals of a pentagon according to the Golden Ratio. The Ratio is sometimes called the "divine proportion", which is particularly apt as many religious paintings use it.
have an especially aesthetically pleasing aspect. The Parthenon in Athens has the same ratio of lengths. The five-pointed stars on many flags of the world (for example, the European flag) are made by cutting the
diagonals of a pentagon according to the Golden Ratio. The Ratio is sometimes called the "divine proportion", which is particularly apt as many religious paintings use it.
The beauty - and the usefulness - of mathematics depends in part on the way in which it can link together many apparently unrelated topics (for example, rabbits, sunflowers and painting) in a coherent whole. The worlds of nature and science are founded on a bedrock of mathematics.
Further reading:
- The life and numbers of Fibonacci from Issue 3
- Fibonacci numbers and the Golden Section at the University of Surrey
- Leonardo Fibonacci at the MacTutor History of Mathematics Archive
- Fibonacci Number at Eric Weisstein's World of Mathematics
February 2000: Maths Stirs
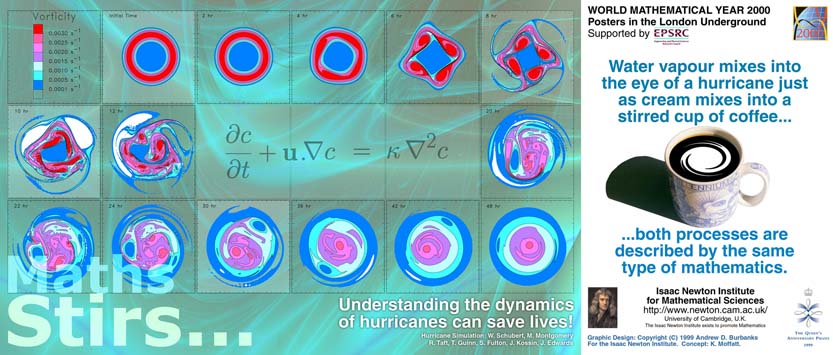
Hurricanes have huge potential for damage to both life and property, but are incredibly difficult to predict. If we were able to tell which direction they were likely to travel in then we would be able to take evasive action. Mathematics can in principle provide the answer to this complex problem; one of the crucial equations describes the mixing process in a swirling flow, a problem familiar at the breakfast table when we stir cream into a cup of coffee.
Cyclones arise over the deep tropical ocean by a process of convergence of airflow which intensifies the rate at which the air spins: it is like the familiar bathtub vortex, but on a very much larger scale. The pressure is low at the centre of the resulting atmospheric vortex, and so water vapour and droplets are sucked up into the vortex from the ocean surface. A complex process of interaction between the swirling air flow and the water vapour ensues. This process influences the power of the vortex and whether it will eventually turn into a tropical cyclone with devastating destructive potential: if it does, then the cyclone interacts with atmospheric winds in further complex processes that determine its path across the ocean surface. Mathematicians seek to predict this path in order to give warning of potential disaster when the cyclone hits land.
The mixing of water vapour within the vortex is a crucial part of this whole scenario. This mixing process is described mathematically in its simplest form by the famous "advection-diffusion equation" shown on the poster. In this equation, represents the concentration of water vapour. There are two processes that change :
- advection (i.e.transport of the water vapour by the air flow)
- diffusion (i.e.spreading out by molecular effects)
 represents the velocity of the swirling air flow, and the term
  in the equation represents the advective process.
  measures the rate of the diffusion of water vapour in air, and the term
  represents the diffusion process.
What happens in practice is that, just as observed in the analogous "cream in coffee" experiment, advection by circulating flow generates tightly wound spirals of water vapour (or of cream and coffee) - so tight that molecular diffusion is always important no matter how small may be. The interaction between advection and diffusion is
subtle, and can only be understood through mathematical and computational analysis of the advection-diffusion equation. In the real-life situation, there are many other complications, some of which are considered in detail in the paper by Schubert et al (1999) from which the computer simulation shown in the poster was drawn.
The type of advection-diffusion process described above occurs in many other contexts. For example, it plays a part in the process by which spiral galaxies are formed. Think of this when you drink your next cup of coffee! In both contexts, the inner regions rotate more rapidly than the outer regions, and this is why spirals are formed.
Ref. Schubert WH, Montgomery MT, Taft RK et al: Polygonal eyewalls, asymmetric eye contraction, and potential vorticity mixing in hurricanes Journal of the Atmospheric Sciences 56, 9, 1 May 1999
Further reading:
- The UK Met Office Tropical Cyclone page, which includes images and movies of past cyclones
- Tropical Cyclones - bulletins and reports from the University of Hawaii Meteorology Department
- Hurricanes and tropical cyclones - more movies and educational fun from the NASA-funded Athena site
- An impressive animated simulation of the formation of a spiral galaxy at Cardiff University Dept of Physics and Astronomy
March 2000: MathsPredicts
The weather is notoriously hard to predict. Ever since Michael Fish famously declared on national television in October 1987 that there was going to be no hurricane, the day before the worst storms since 1703, people have been wary of weather reports. But in fact our ability to forecast the weather has improved immeasurably in the past few decades: mathematical researchers have been working with meteorologists, oceanographers and physicists since the end of World War II on the problem.
There are many difficulties in weather prediction. When it's raining in your town, it is quite possible for it to be dry (or even sunny!) just a few miles away. No TV presenter can show that level of detail on a weather map, and whatever the presenter says somebody will complain that it wasn't right. Another difficulty is that the weather is chaotic - which means that tiny changes in the atmosphere today can result in completely different weather patterns in a few days' time. This is known as the "Butterfly Effect": if a butterfly decides to flap its wings in Florida Springs then it could cause a hurricane in Spain a week later. This is one of the hallmarks of a chaotic system. The phenomemon of chaos is still not completely understood and mathematicians work on it even today.
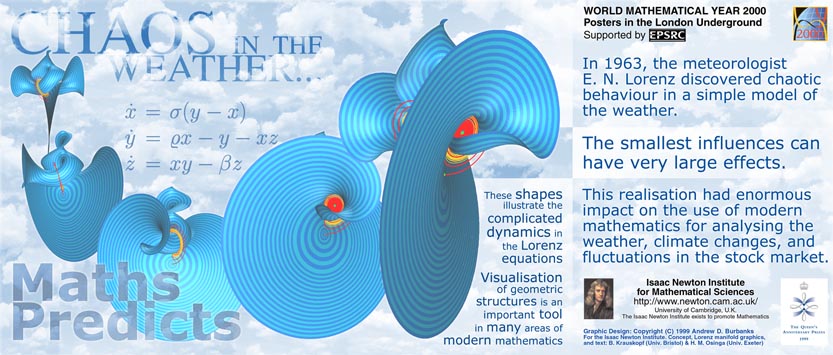
In 1963 the metereologist Edward Lorenz, working at the Massachusetts Institute of Technology in the USA, invented and studied a simplified model of thermal convection, which can be seen as a very basic model of the weather. This model consists of only the three "differential equations" as shown on the poster:

It would take too long to explain here what the variables x, y and z describe physically, but a readable account of the derivation of these equations can be found in the book by Peitgen, Jurgens and Saupe. The greek letters ![]() (sigma),
(sigma), ![]() (rho) and
(rho) and ![]() (beta) are parameters of the system, and Lorenz used the now classic values of 10, 28 and 8/3 respectively. To his surprise he found that the equations behaved in an unpredictable way: the smallest changes in the starting conditions lead to very different evolution of the system after only a short
time. Despite its simplicity, the system is chaotic.
(beta) are parameters of the system, and Lorenz used the now classic values of 10, 28 and 8/3 respectively. To his surprise he found that the equations behaved in an unpredictable way: the smallest changes in the starting conditions lead to very different evolution of the system after only a short
time. Despite its simplicity, the system is chaotic.
In spite of this chaotic nature there is a remarkable structure in the equations: it is possible to find a so-called "strange attractor", which is shown on the poster as the yellow spiralling set of points. Whatever initial conditions you use, the system of equations is attracted to this set; but the motion on the attractor is very unpredictable and continually mixes around. The Lorenz attractor (as it is called today) turned out to be a prototype for chaos in other dynamical systems. Similar chaotic attractors have been found in many areas of study, for example, in mechanical, electronic and optical systems.
So Lorenz had showed that even seemingly simple systems can have astonishingly complicated dynamics. And that means that the weather is at least as complicated.
The study of the exact nature of chaos in the Lorenz equations remains an active field of research. In order to bring out the structure of the system it helps to find the "stable manifold" of the system, which is a collection of the special points which, when used as initial conditions, lead to the system ending up at another special point x = y = z = 0 (which happens to be a point of unstable equilibrium of the system). The stable manifold is difficult to compute, but a new method has been found (see the links below) which has enabled us to show it on the poster as the blue surface. It is calculated by "growing" it in concentric rings, which can be seen on the poster in different shades of blue. The poster also illustrates the importance of visualisation tools in modern mathematics.
The study of chaos is important in many fields other than the weather: the movement of share prices in the Stock Exchange, and turbulence in fluids, for instance. Much more work has yet to be done!
References:- H.-O. Peitgen, H. Jurgens and D. Saupe: Chaos and Fractals, Springer Verlag 1992.
- J. Gleick: Chaos, the Making of a New Science, Heinemann 1987.
Further reading:
- Numerous web sites featuring images, animations and further information on the Lorenz system can be found on the web by searching for "Lorenz attractor". We recommend that you look for yourself.
- A gallery (with animations) showing the computation of the stable manifold, and more information about the new method by Krauskopf and Osinga used to obtain it.
- The UK Meteorological Office has lots of information about the weather in Britain and worldwide.
- More information about the Butterfly Effect by Michael Cross, complete with a Java applet of the Lorenz attractor.
- A BBC web page about turbulence and its links to chaos.
- More about chaos from the University of Santa Fe.
About the author
Keith Moffatt is a fellow of the Royal Society and Director of the Isaac Newton Institute for Mathematical Sciences, a national and international visitor research institute at the University of Cambridge.
His own research interests lie in the field of fluid dynamics.