Harder, better, faster, stronger
After every Olympics, there is speculation about which country performed best. Should we really be surprised when China, with its huge population, and the US, with its combination of high GDP and population, top the medal table? Can we take a look at the medal tables and see which countries did indeed perform better than expected?
In terms of total medals won, the same five countries topped both the 2000 Sydney Olympics table and the 2004 Athens Olympics table:
| Position | Country | 2000 Medal Count | Country | 2004 Medal Count | |
| 1 | United States | 92 | United States | 103 | |
| 2 | Russia | 88 | Russia | 92 | |
| 3 | China | 59 | China | 63 | |
| 4 | Australia | 58 | Australia | 49 | |
| 5 | Germany | 56 | Germany | 49 |
By-and-large the same countries rise to the top each Olympics, but a quick look at the medal tables seems to suggest two obvious variables that may play a part in a country's Olympic success — population and Gross Domestic Product (GDP). A high population gives a country more athletes to draw from, while GDP could be assumed to represent a country's prosperity, with a prosperous country more likely to spend money on frivolous activities such as sport. Adjusting for population, we see that the top 5 countries have changed, except for Australia, who has over-performed for its population:
| Position | Country | 2000 Medal Count | Population ('000s) per medal |
| 1 | Bahamas | 2 | 142 |
| 2 | Barbados | 1 | 259 |
| 3 | Iceland | 1 | 273 |
| 4 | Australia | 58 | 324 |
| 5 | Jamaica | 7 | 379 |
| Position | Country | 2004 Medal Count | Population ('000s) per medal |
| 1 | Bahamas | 2 | 150 |
| 2 | Australia | 49 | 406 |
| 3 | Cuba | 27 | 419 |
| 4 | Estonia | 3 | 447 |
| 5 | Slovenia | 4 | 503 |
India, with its huge population, under-performed in 2004, with one medal per one billion people, however we may expect with its rising GDP that it could come near the top of future lists. Looking at GDP, we find a new top 5, with Australia dropping out, but Cuba, Jamaica and the Bahamas again performing well:
| Position | Country | 2000 Medal Count | GDP ($ '000,000s) per medal |
| 1 | Cuba | 29 | 597 |
| 2 | Jamaica | 7 | 1257 |
| 3 | Georgia | 6 | 1867 |
| 4 | Macedonia | 1 | 2100 |
| 5 | Bulgaria | 13 | 2585 |
| Position | Country | 2004 Medal Count | GDP ($ '000,000s) per medal |
| 1 | Cuba | 27 | 1170 |
| 2 | Jamaica | 5 | 2042 |
| 3 | Bahamas | 2 | 2550 |
| 4 | Georgia | 4 | 3045 |
| 5 | Eritrea | 1 | 3300 |
Is there a way to predict how many medals a country will win at the Olympics, and can we at least set a baseline on which we can judge a country's success? Looking at simple plots of medal tally against population and GDP for the 2004 games, it can quickly be seen that linear models of these variables will be unsatisfactory — that is, the data points do not cluster around any straight line:
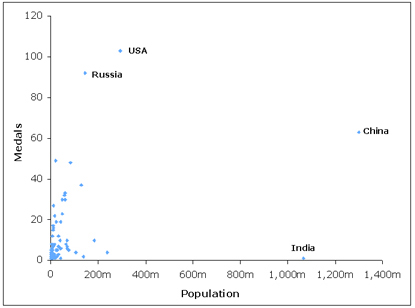
Medal count vs population.
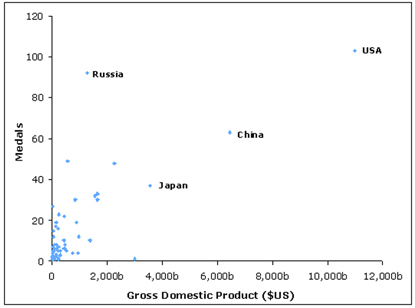
Medal count vs GDP.
The extreme values of GDP and population suggest that logarithms should be used. In a logarithmic graph, the axes are rescaled so that the interval between 1 and 10 is the same as between 10 and 100, and 100 and 1000 etc. This makes practical sense — a country with a high population does not get to enter more athletes in the Olympics than lowly populated countries, and whilst a high population gives a strong base from which to draw quality athletes, as population increases, this effect will diminish. With regards to GDP, countries occasionally produce athletes with so much natural ability that no amount of money spent on training the opposition could defeat them. Findings in the report Do elite sports systems mean more Olympic medals? by Simon Geoffrey, Martina Kerim, Peren Arinb, Nitha Palakshappac and Sylvie Chettyd from the Department of Commerce at Massey University back this up, with the authors suggesting that "the extraordinary talent required in winning a gold medal cannot be surpassed by the employment of an elite sports system."
Looking at the countries that received more than 15 medals in 2004, plots of the logarithm of medal count against the logarithms of population and GDP show a linear relationship. Using linear regression — a form of analysis that fits a straight line to the data by minimising the distances between the data points and the fitted curve — we can find a straight line that fits well. We found that the R2 values of this fit (R2 is a statistical measure of correlation between 0 and 1) are above 0.5, suggesting that, while not quite high enough to prove a correlation, we may be on to something:
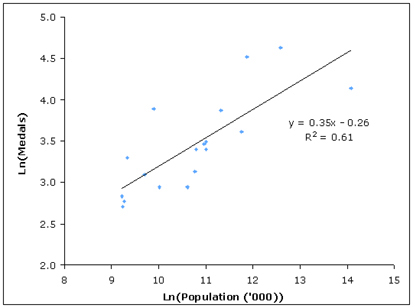
Log medals vs log population.
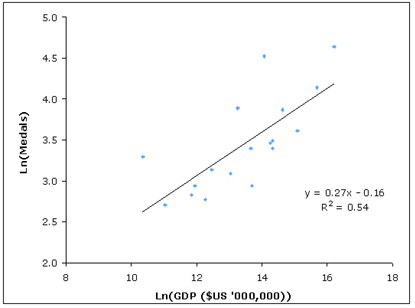
Log medals vs log GDP
Using a linear combination of the logarithms of GDP and population, we can come up with a fitted line:

Linear combination of Ln(GDP) and Ln(Population) vs Ln(medal count).
We can see that Cuba, Australia and Russia all fall above the line of best fit and so compared to the other countries who received more than 15 medals, achieved well. This could be explained by Cuba's famous tradition of boxers and the spending of Australia and Russia on sport. The much bemoaned UK Olympic team did not perform nearly as badly as commentators made out.
The danger with any such fitted model is that you can fit anything to anything after the event — the challenge is to come up with a worthwhile representative model that can not only let teams know how they are doing now, but can predict how they may do in the future.
In the paper Who wins the Olympic games: Economic development and medal totals, Andrew B. Bernard and Meghan R. Busse from The National Bureau of Economic Research developed a model that includes population, GDP, whether the country was the Olympic host and whether the country was formerly part of the Soviet Union or eastern block. They found that countries win 1.8% more medals when host than otherwise, and similarly, found that former Soviet Union or eastern block countries, because of their forced mobilisation of resources towards sport, and countries with planned economies, won more than 3% more medals than equivalent western countries. Their model is formulated as: \ $$ M = C + \alpha \ln N + \beta \ln \frac{Y}{N} + Host + Soviet + Planned $$ where\ $ M $ is a country's medal count, $ N $ is the population, $ Y $ is the GDP, $ C, $ $ \alpha $ and $ \beta $ are constants, and $ Host, Soviet $ and $ Planned $ are constants equal to zero or some value depending on whether the country was the host, part of the Soviet block, or had a planned economy.
In their more developed models, the authors included terms to represent how countries performed at previous Olympic games — perhaps to represent the experience gained by athletes competing at multiple games. Their overall conclusion is that whilst GDP is the best single variable for predicting medal tallies, other factors such as being the host country need to be included. Indeed, their model predicted that Australia would win 17 more medals than otherwise when it hosted the Sydney Olympics — the model was only one short of the actual 18 extra medals Australia did win.
With this in mind, it is hard to look past China, as host country and with vast amounts of money pouring into Olympic sports for just this occasion, topping the medal tally.
Resources:
- Plus used data from the World Bank and the International Olympic Committee to do its analysis. Due to doping scandals, the medal tables may change but are accurate at the time of writing.
- Price Waterhouse Coopers has released a report predicting results for the 2008 Olympics based on the previous work done in this field at The National Bureau of Economic Research — not surprisingly they pick China to do well.