
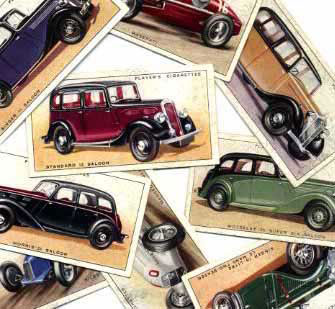
Last weekend, hidden between books in the back of my bookcase, I came across two sets of cards that I collected as a young child. Each of them contained fifty high quality colour pictures of classic motor cars with a rather detailed description of their origins, design and mechanical specification on the reverse. Collecting sets of cards was all the rage. There were collections of wartime aircraft, animals, flowers, ships, and sportsmen — since these collections all seemed to be aimed at boys — to be amassed from buying lots of packets of bubble gum, breakfast cereals, or packets of tea. Of the sports cards, just like today's Panini "stickers", the favoured game was football (in the US it was baseball) and I always had my suspicions about the assumption that all the player's cards were produced in equal numbers. Somehow everyone seemed to be trying to get the final "Bobby Charlton" card that was needed to complete the set. All the other cards could be acquired by swapping duplicates with your friends but everyone lacked this essential one.
It is a relief to discover that even my own children engaged in similar acquisitive practices. The things collected might change but the basic idea was the same.
So what has mathematics got to do with it? The interesting question is to ask how many cards we should expect to have to buy in order to complete the set, if we assume that each of them is produced in equal numbers and so has an equal chance of being found in the next packet that you open. The motor car sets I came across each contained 50 cards. The first card I get will always be a new one, but
what about the second? There is a 49/50 chance that I haven't already got it. Next time it will be a 48/50 chance and so on. After you have acquired 40 different cards there will be a 10/50 chance of the next one being one you haven't already got. So, on the average, you will have to buy another 50/10, or 5 more cards to have a better than even chance of getting another new one that you need for
the set. Therefore, the total number of cards you will need to buy on average to get the whole set of 50 will be the sum of 50 terms:
![\[ 50/50 + 50/49 + 50/48 + ... + 50/3 + 50/2 + 50/1, \]](/MI/fdc623c835eebe99080cf249ffc8f057/images/img-0001.png) |
As there can be collections with all sorts of different numbers of cards in them, let's consider acquiring a set with any number of cards in it, and let's call this number N. Then the same logic tells us that on the average we will have to buy a total of
![\[ N/N + N/(N-1) + N/(N-2) + ... + N/3 + N/2 + N/1. \]](/MI/d5cdc8f6dfb5cacf24c94aca36ebd765/images/img-0001.png) |
![\[ N(1 + 1/2 + 1/3 + ... 1/N). \]](/MI/9840e03b5c3a202d1370a18ba43b11f0/images/img-0001.png) |
![\[ N\times [0.577 + ln(N)]. \]](/MI/46f71d592fb314a9b3b9a84396e61906/images/img-0001.png) |
Incidentally, our calculation shows how much harder it gets to complete the second half of the collection than the first half. The number of cards that you need to buy in order to collect N/2 cards for half a set is
![\[ N/N + N/(N-1) + N/(N-2) + ... N/(N/2+1), \]](/MI/808a7035ea90a21cf9e39c99f0be48e8/images/img-0001.png) |
![\[ N\times [ln(N) + 0.577 - ln(N/2) - 0.577] = N\times ln(2) = 0.7N. \]](/MI/ddc0f69a7f915a5d528d5d11f13cad68/images/img-0001.png) |
Suppose that you have F friends and you all pool cards in order to build up F + 1 sets so that you have one each. How many cards would you need to do this? On average, when the number of cards N is large, and you share cards, the answer approaches
![\[ N\times [ln(N) + F\times ln(ln(N)) + 0.577]. \]](/MI/37854b5ebfd065b1ad4bd4c9c50529ce/images/img-0001.png) |
![\[ (F + 1)\times N\times [ln(N) + 0.577] \]](/MI/04fa79f313dc32f0d8a071e6263a59c1/images/img-0001.png) |
If you know a little statistics, you might like to show that the standard deviation on the
![\[ N\times [0.577 + ln(N)] \]](/MI/970219e4a6c9193ec72130d7512e14ad/images/img-0001.png) |
There was a story a few years ago that a consortium were targeting suitable national lotteries by calculating the average number of tickets that needed to be bought in order to have a good chance of collecting all the possible numbers — and hence including the winning one. They neglected to include the likely variance away from the average result and were very lucky to find that they did have a winning ticket among the millions they had bought.
If the probability of each card appearing is not the same then the problem becomes harder but can still be solved. In that case it is more like the problem of coin collecting where you try to collect a coin with each available year date on. You don't know that equal numbers were minted in each year (almost certainly they weren't) or how many may have been withdrawn later, so you can't rely on their being an equal chance of collecting an 1840 penny or and 1890 one. But if you do find a 1933 English penny (of which only 7 were made and 6 are accounted for) then be sure to let me know.
Hint: to work out the standard deviation, you'll need to know that
![\[ 1 + 1/4 + 1/9 + ... = \sum _{N=1}^\infty 1/N^2 = \pi ^2/6 \]](/MI/4574007fa2dea895008ddc5602d78730/images/img-0001.png) |
Did you manage to answer the puzzle posed in Outer space: series? If not, you can find the answer here!