
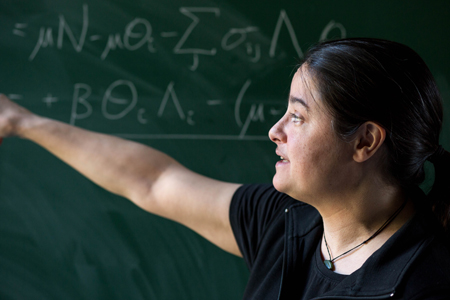
Julia Gog. Photograph by Henry Kenyon.
"Life is not going to be the same for a long time," says Julia Gog, an epidemiologist at the University of Cambridge. Gog's own life changed abruptly in early February, when she dropped her normal duties at the Centre for Mathematical Sciences and started to devote all her efforts to SPI-M, a modelling group which feeds its results into the Scientific Advisory Group for Emergencies (SAGE). SPI-M has run for some time in preparedness for influenza pandemics, but now has been turned over to focussing on the pandemic of COVID-19. Gog is also on the steering committee of a national consortium, led by the Royal Society, to deal with the pandemic.
SPI-M's job is to develop and use mathematical models that can help us predict what will happen next and how different interventions might change that: how the COVID-19 pandemic is going to evolve and what effect the social interventions we are all living through now are likely to have. But what are these models and are they accurate?
The models
The SIR model
Let  denote the number of susceptible people,
  the number of infected people, and
  the number of recovered people. The equations for the SIR model are
 |
 |
 |
|||
 |
 |
 |
|||
 |
|
 |
Here  is the transmission rate and
  is the recovery rate. The expressions
  represent the rate of change over time, so
  means the rate of change of the number of susceptibles over time.
The number  where
where  is the size of the population, is called the basic reproduction number of the disease.
You can find out more about the SIR model in this article.
You may not have noticed it, but there’s a good chance you’ve already dabbled in some mathematical modelling yourself. If you have heard that the number of infections with COVID-19 doubles every three days, you may well have worked out that, if today we have  cases and this trend continues, then we will have
 cases in 3 days,
 cases in 6 days,
 cases in 9 days
and, generally,  in 3
in 3 days. That’s the steep growth which has led to this disaster.
This extrapolation, simple as it may be, highlights the basic ingredients of a model: a mathematical expression which describes the general nature of the change that will happen over time and parameters which pin down the exact shape of the change. In our example we have exponential growth over time, and the steepness of this growth is decided by the parameter of the doubling time, which is 3 days.
See here for all our coverage of the COVID-19 pandemic.
If you want longer term predictions and to simulate the impact of interventions in detail, you need a more sophisticated model. Different models are designed for different purposes, such as making short term predictions, long term predictions, or simulating the effect of particular interventions such as school closures. But although models differ, they tend to be built around an approach that has been around since the 1910s: the SIR model.
To get the general idea behind the SIR model, imagine a population of people in which everyone is either susceptible to a disease (S), infected (I), or recovered (R) and therefore immune. The way people pass from the S class into the I class, and then from the I class into the R class, is described by mathematical equations. These equations depend on the transmission rate for the disease and also the recovery rate. You start the model off with only a small proportion of the population in the I class, and then let it evolve over time, seeing how the disease spreads and then subsides as people recover and become immune.
Although simple, the SIR model gives good predictions for simple populations, such as students at a boarding school. When it comes to more complex populations you can link up many individual SIR models representing different geographical locations and sub-populations, including for example individual towns or schools.
Contacts are key
What is hugely important in this context are people's contact patterns: who meets whom and how frequently. Information on this comes from social mixing studies. An example is a large-scale citizen science project which ran in 2018 as a collaboration between the BBC and Gog's team. Here people were asked to download an app which tracked their movements and asked them to keep track of the people they met (all suitably anonymised). Such contact data is represented mathematically by arrays (matrices) of numbers (see the figure below) which are built into the model.
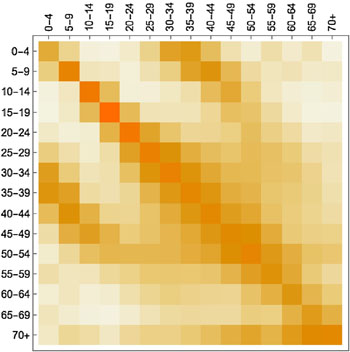
A contact matrix displaying average contacts between different age groups. Darker shades indicate more contacts (here the colours are used instead of numbers to make the matrix easier to understand). The figure is from the paper Contagion! The BBC Four Pandemic – The model behind the documentary. Used by permission.
To see how a particular social intervention, such as school closures, might affect the spread of the disease, you adapt the contact data accordingly by removing or scaling down parts of it that relate to some intervention.
But you have to be careful. "Is entirely switching off the school component realistic, well no, it should just be reduced because key worker kids are still going to go to school," says Gog. "And if there isn't clear guidance, then the children off school might end up mixing together in other ways, or with their grandparents, which means there's additional contacts happening that need to be taken into account. Though we can only guess at the extent of them." Existing data, such as information on what happened during teacher strikes, can help you calibrate your contact data to reflect interventions and predict their effect on the epidemic. This, put simply, is how epidemiological modelling works.
But are the models right?
There isn't just one epic model designed to represent the whole of the UK, Europe, or even the entire world. Instead, there are many different ones designed to do different things and, although the compartmental approach of the SIR model is a ruling paradigm, models can still be different in their nature. Some are completely deterministic, others contain a degree of randomness, some are designed to run just once to demonstrate the role of one particular factor, others are run many times to get ranges of predictions in the face of uncertainty.
The big question is whether the models are realistic. One problem is that COVID-19 is a new disease and existing models were developed for seasonal flu. "We all started from influenza, no one had a corona pandemic model," says Gog. "So at the [start of this pandemic] we had to ask what might be systematically different between COVID-19 and the typical models we had built for influenza."
Although the pandemic dynamics are similar for 'flu and the coronavirus, there are differences. One is that for COVID-19 there's a substantial latent period: a person can have the infection without showing any symptoms. "For 'flu maybe you get a few hours of that, but for this coronavirus it can be a few days," says Gog. In terms of the model this means moving into the world of SEIR, where E stands for "exposed": people in this class have the infection but no symptoms yet. The E class can be split further into those who are infectious to others and those who aren't. "All models are approximations, and for 'flu you can often get away with SIR, depending on what you are trying to address with the model. But ignoring the latent period for this virus would be a much worse approximation, especially if making short-term predictions, so usually it does need to be considered," says Gog.
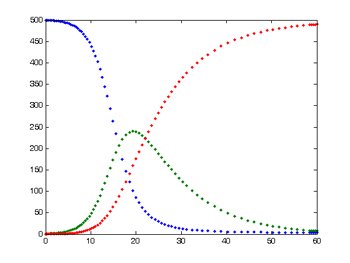
This is the typical output from a simple SIR model. The number of susceptible people is shown in blue, the number of infected in green, and the number of recovered in red.
There are also plenty of other things we don't know about COVID-19. "There are some details we just do not know, for example exactly how infectious you are on day one, or on day two," says Gog. "Inferring that from imperfect data is very hard, though we do now have some data from China and other countries, and the data from cruise ships have been very interesting. You just try and do your best to extrapolate from limited information." When there isn't enough information, modellers decide which of the unknowns are most important to resolve in order to remove uncertainty — making such calls is a critically important aspect of modelling.
The importance of any one parameter can depend on exactly what you are trying to do. "To predict how many cases there are going to be tomorrow you don't need to know many things. It's almost exponential at the moment," says Gog. "But to make a prediction about whether there is going to be a second wave you need to know some really very different things."
An important number for longer term predictions is the basic reproduction number of a disease (often denoted as  ): the number of people an infectious person will infect on average, assuming that everyone in the population is susceptible to the disease (it is related to the transmission rate, see the box above). For COVID-19 this is estimated to lie between 2 and 2.5. Modellers will often run their model for each of a range of possible values, coming up with a range of corresponding predictions.
Infected but not ill
Another important number, for which many epidemiologists would currently give a limb, is the number of true cases of the infection in the population, which includes the number of cases of people who have had the disease but shown no symptoms. "The number of asymptomatics is the number that I lose sleep over at the moment. Knowing this is crucial for our exit strategy," says Gog.
This is because there are basically two things that can reduce the current exponential growth. "The first is that the contact rates change under interventions such as school closures and physical distancing: this is the entire point of these," says Gog. "The second thing that changes the exponential process is the depletion of susceptibles." Since having had the disease will make you immune for some time, knowing the true number of cases including asymtpomatics, will tell you how fast the class of susceptible people will become smaller. The much-discussed mechanism of herd immunity means that as the number of susceptibles reduces, the exponential growth of the disease flattens out, and then becomes exponential decay.
Luckily there is hope as far as knowing data about the asymptomatics is concerned. Antibody tests which can tell whether a person has had the disease, knowingly or not, do now exist, although the first wave of these will understandably only be rolled out to NHS staff.
But even with imperfect information, modelling predictions are not just stabs in the dark especially if they account for and present the range of uncertainty. Good models comprise all the relevant information we do have. Good modellers keep careful track of the limitations of their models and the uncertainties within them, often including ranges of possible parameter values, which then lead to ranges of predictions: ranges of possible future scenarios that may occur under different intervention strategies. The predictions won't be perfect, but they are the best we can do with the information we have.
So what is going to happen?
Nobody can tell exactly what is going to happen. A big hope on the horizon is the arrival of a vaccine, another means by which herd immunity can be built with the options of protecting the most vulnerable as priority, expected in about twelve to eighteen months. The question is how to get ourselves to that point with the least amount of damage done.
One thing that everyone agrees on is that this will involve long term sacrifices. "We can't just shut down for a week and expect this thing to be gone," says Gog. "It's going to still be here [if social distancing measures are lifted too soon] and we'll have no herd immunity. At the moment we've got no choice but to shut down to ensure our health care system is not pushed over capacity, but we are very aware that this isn't a permanent strategy."
A paper published last week by a former PhD student of Gog's, Stephen Kissler, and colleagues at Harvard had a detailed look at the problem of resurgence, taking account of seasonal variations too: outbreaks of respiratory diseases tend to be worse in autumn and winter, putting an even greater strain on health care systems as they coincide with seasonal flu outbreaks. Kissler and his team used an SEIR model that included components reflecting such seasonal variations. The effect of social distancing measures is reflected in the model by a reduction of the basic reproduction number of COVID-19 by up to 60%, on par with what was observed in China.
The conclusions of this latest study aren't exactly cheerful. A single period of social distancing isn't going to be sufficient to stop critical care capacity from being overwhelmed (the study looked at critical care capacity in the US, rather than the UK, but similar results will apply in the UK). "[According to this study] we are looking at a period of serial lock downs," says Gog. "The idea is that you lock down when critical care is about to keel over. But what is happening in the UK is that the NHS is expanding its provisions, so hopefully our lock downs can get shorter and less severe and not too frequent."
Just how long and frequent these intermittent periods of social distancing are likely to be under different assumptions (based on US figures) is shown in the figures below, taken from the paper.
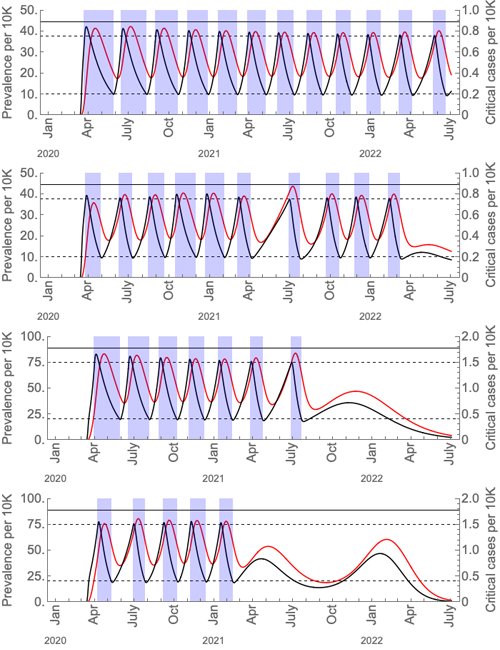
These graphs show the prevalence of the virus (black curves) and critical cases (red curves) under intermittent social distancing (shaded blue regions). The first and third graphs are without seasonal forcing; the second and fourth with seasonal forcing. Critical care capacity is depicted by the solid horizontal black bars; the first two graphs are the scenarios with current US critical care capacity and the third and fourth graphs are the scenarios with double the current critical care capacity. The maximal value of the basic reproduction number is 2 in wintertime, and for the seasonal scenarios it is 1.4 in summertime. The figure is from the paper Social distancing strategies for curbing the COVID-19 epidemic by Kissler et al. Used by permission.
Within all this gloom there are, however, a couple of rays of hope. One is that medication and better treatment protocols for the severe cases of COVID-19 may arrive at some point. This would mean that people would get less sick for shorter periods of time, reducing pressure on the NHS. Since much of the severity of social distancing measures is down to our need to keep the NHS from collapsing, so that people with severe disease can be effectively cared for, this may then also mean less draconian measures for shorter periods of time.
The other ray of hope goes back to that unknown total number of mild and asymptomatic infections. If this is much higher than assumed in the model, if many more people have been sick and are now immune, then the outlook isn't anywhere near as bad as the figures above suggest. We can only hope that this is the case. Until we find out, all we can do is stick to the rules and stay at home.
About this article
Julia Gog is Professor of Mathematical Biology at the University of Cambridge. She is a member of SPI-M, a modelling group which feeds its results into the Scientific Advisory Group for Emergencies (SAGE). She is also a member of the steering committee of a national consortium, led by the Royal Society, to deal with the COVID-19 pandemic.
Marianne Freiberger, Editor of Plus, interviewed Gog on March 24, 2020. The article is part of our collaboration with JUNIPER, the Joint UNIversity Pandemic and Epidemic Response modelling consortium, for which Gog is Principle Investigator. JUNIPER comprises academics from the universities of Cambridge, Warwick, Bristol, Exeter, Oxford, Manchester, and Lancaster, who are using a range of mathematical and statistical techniques to address pressing questions about the control of COVID-19. You can see more content produced with JUNIPER here.

Comments
Math against COVID-19
Checkout what applied mathematicians in Europe are doing to fight COVID-19.
https://ecmiindmath.org/2020/04/01/coronavirus-2/