
The power of snooker

Snookered... (Photo by Florian Albrecht – CC BY-SA 3.0)
#/media/File:Snookered_on_two_reds.jpg)
A particular mathematical relationship known as a power law has been observed in many day-to-day situations, from the frequencies in which words are used in natural languages to the connectivity distribution in Facebook friendship networks. As it turns out, though, such a power law can also be found in snooker statistics. And if the amazing Ronnie O'Sullivan continues to produce centuries at the same rate, the mathematical correspondence will be even better!
Power laws
In mathematics, we say a given value x is raised to the power k if it is multiplied by itself k times. Common examples where such mathematical power functions are used are in the calculation of the area of a square that has sides of length x, which is equal to x2, or the volume of a cube with sides of length x, which is x3.
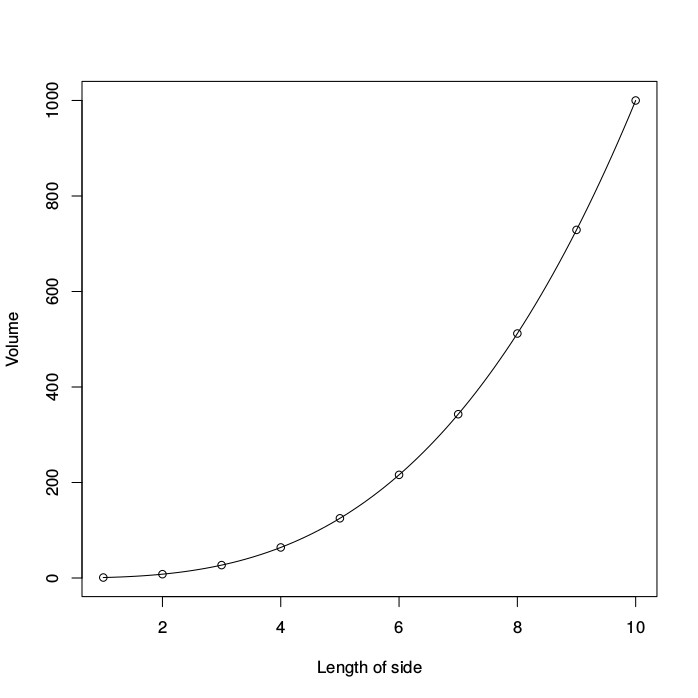
The volume (y, vertical axis) of a cube against the length of its sides (x, horizontal axis). The open circles represent actual measurements on different cubes. The solid line represents the mathematical relationship y=x3, which forms a perfect fit to the observed data.
A power law is a mathematical relationship between two variables, say x and y, such that the value of one is directly related to the value of the other raised to a certain power, for example, y=xa for some fixed value of a. This value a is called the exponent of the power law. For example, if we were to measure the volume (y) of many cubes with different lengths of their sides (x), we would find a perfectly fitting power law with an exponent a=3.
Power law relationships are found in many common systems and processes, both natural and man-made. For example, power laws are observed in the frequency distribution of the magnitudes of earthquakes, or the sizes of cities in a given country. They also show up in the distribution of connections in networks like Facebook friendships, movie star co-appearances, or the national electricity grid. And they occur in the frequencies of words used in natural languages, or even in computer code. (You can read more about power laws in language and networks on Plus.)
In the example above, the data is plotted on a linear scale. In other words, each point along an axis represents a value that is larger than the previous point by a fixed amount. However, it is also possible to plot the same data on a non-linear scale. An example of such a non-linear scale is a logarithmic scale, which is based on orders of magnitude rather than a linear increase. This means that the value represented by each point along an axis is the value of the previous point multiplied by a fixed amount.
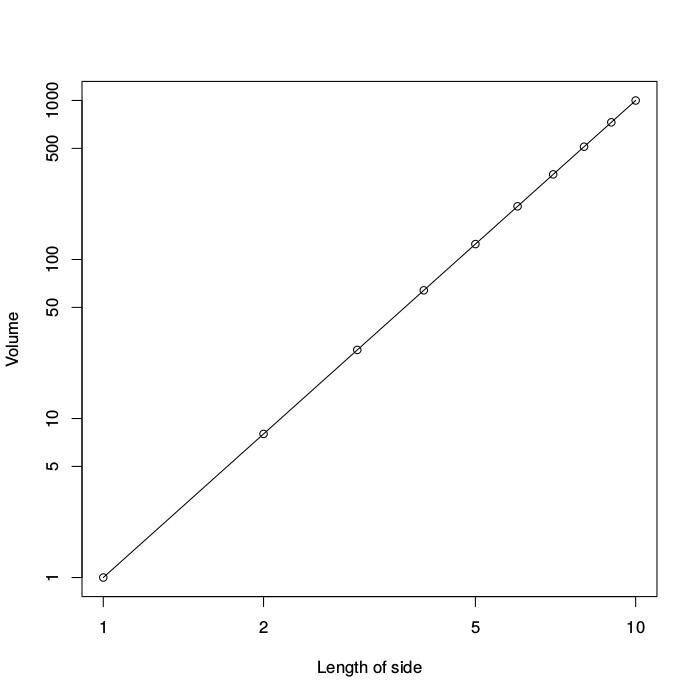
The volume (y, vertical axis) of a cube against the length of its sides (x, horizontal axis) using a logarithmic scale on both axes. The data points (open circles) now fall along a straight line representing a power law with exponent a=3.
An example of this can be found in the way that the strength of an earthquake is indicated. A magnitude three (M3) earthquake releases a certain amount of energy, which translates into the amount of shaking we feel. However, a magnitude four (M4) earthquake releases an amount of energy that is ten times larger than an M3 earthquake. Similarly, an M5 earthquake is again ten times as strong as an M4 earthquake, and thus one hundred times stronger than an M3 earthquake.
The figure to the right shows the same data for the volume of a cube, but using such a logarithmic scale on both axes, resulting in a so-called log-log plot. Mathematically, a logarithmic function is the inverse of a power function. As a consequence, a power law shows up as a straight line in a log-log plot, as this figure illustrates.
Finding the power
Unfortunately, most real-world data does not behave as nicely as the volume of a cube. In reality, there is always some noise in the data due to imprecise measurements, random fluctuations, or missing data. An example is given in the figure below, which shows a log-log plot of the frequencies of words used in English (as measured over a large collection of different texts) against their rank, where the most frequent word ("the") has rank one, the second most frequent word ("be") rank two, and so on.
As the figure shows, the data points do not fall along a straight line perfectly, but still reasonably well. The solid straight line represents a power law that best fits the given data, which can be calculated using a standard statistical technique known as a regression analysis. (You can read more about regression analysis here.) This best fit results in an exponent of a=-0.92. The exponent is negative in this case, as the word frequency decreases with increasing rank.
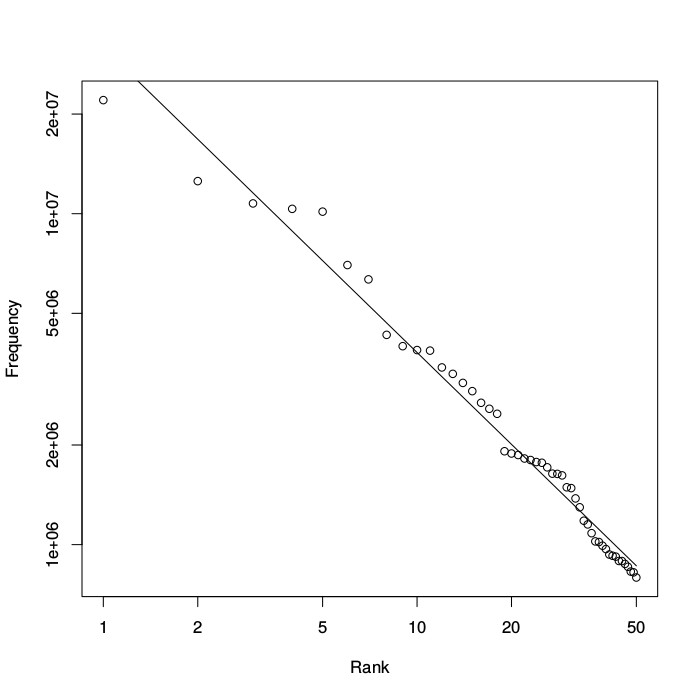
The frequency of words used in English (vertical axis) against their rank (horizontal axis) using a logarithmic scale on both axes. The data points (open circles) closely follow a straight line, although not exactly.
So, the frequency of a word as used in the English language is roughly proportional to its rank raised to the power a=-0.92. It may be difficult to imagine what it means to multiply a number by itself -0.92 times, but mathematically this is perfectly well defined. In other words, the exponent a in a power law does not always need to be a positive whole number.
Finally, the regression analysis that calculates the exponent that gives the best fit also provides a measure of accuracy, that is, how closely the data falls along a straight line. In the case of the volumes of cubes, as we saw above, the accuracy (or fit) is obviously 100%, as the data points fall exactly on the line. However, for the word frequencies the accuracy is slightly less: 98%. Still pretty good.
As these examples have shown, to find out whether a given data set follows a power law, we can simply present the data in a log-log plot, and calculate how closely it falls along a straight line. So let's give this a try with some snooker statistics.
Power laws in snooker statistics
Consider the ranking list of all professional snooker players who have made at least 100 centuries throughout their career. A century break is a score of at least 100 points within one visit to the table (i.e., without missing a shot). There are currently 68 players who have scored at least a "century of centuries". The table below shows the ten highest ranked players according to this statistic, of course topped by the amazing Ronnie O'Sullivan who recently scored his 1000th century, and still going strong!

Ronnie O'Sullivan in action at the snooker table. (Image: DerHexer, CC-BY-SA 4.0).
| Rank | Player | Centuries |
|---|---|---|
| 1 | Ronnie O'Sullivan | 1008 |
| 2 | Stephen Hendry | 775 |
| 3 | John Higgins | 750 |
| 4 | Neil Robertson | 636 |
| 5 | Judd Trump | 602 |
| 6 | Mark Selby | 577 |
| 7 | Ding Junhui | 501 |
| 8 | Marco Fu | 493 |
| 9 | Shaun Murphy | 479 |
| 10 | Mark Williams | 464 |
Now, if we plot the number of career centuries of these 68 players against their rank in this list, but in a log-log plot, we get the result as shown in the next figure. The straight line represents a power law that gives the best fit to the given data, resulting in an exponent of a=-0.63.
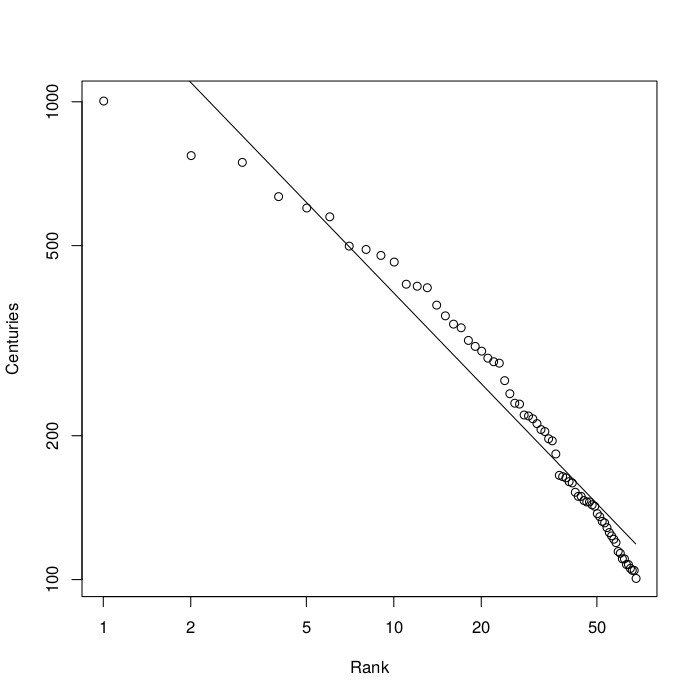
The number of career centuries (vertical axis) against the rank (horizontal axis). The straight line is a fitted power law with exponent a=-0.63.
Note that, as with the word frequencies data, the fit it is not perfect, especially not at the top of the ranking (i.e., the data points in the top left of the plot). This is often the case, especially with ranking data that is still in the making. However, according to the regression analysis, the current fit still has an accuracy of 95%. And if Ronnie O'Sullivan produces a few more centuries, the fit will be even better!
In a similar way, we can look at the number of ranking titles of each player (the number of tournaments they've won which count towards the snooker world rankings). There are currently 26 players who have obtained at least three ranking titles throughout their career. The table below shows the ten highest ranked players according to this statistic.
| Rank | Player | Titles |
|---|---|---|
| 1 | Ronnie O'Sullivan | 36 |
| 2 | Stephen Hendry | 36 |
| 3 | John Higgins | 30 |
| 4 | Steve Davis | 28 |
| 5 | Mark Williams | 22 |
| 6 | Neil Robertson | 16 |
| 7 | Mark Selby | 15 |
| 8 | Ding Junhui | 13 |
| 9 | Judd Trump | 10 |
| 10 | Jimmy White | 10 |
If we plot the number of ranking titles of these 26 players against their rank in the list, again in a log-log plot, we get the result as shown in the figure below. The straight line once more represents a power law that gives the best fit to the data, resulting in an exponent of a=-0.96. The accuracy of the fit is slightly less in this case (92%), mostly due to the top two players (Ronnie O'Sullivan and Stephen Hendry) having exactly the same number of ranking titles. If we would rank them together as a joint number 1, the fit would actually be excellent.
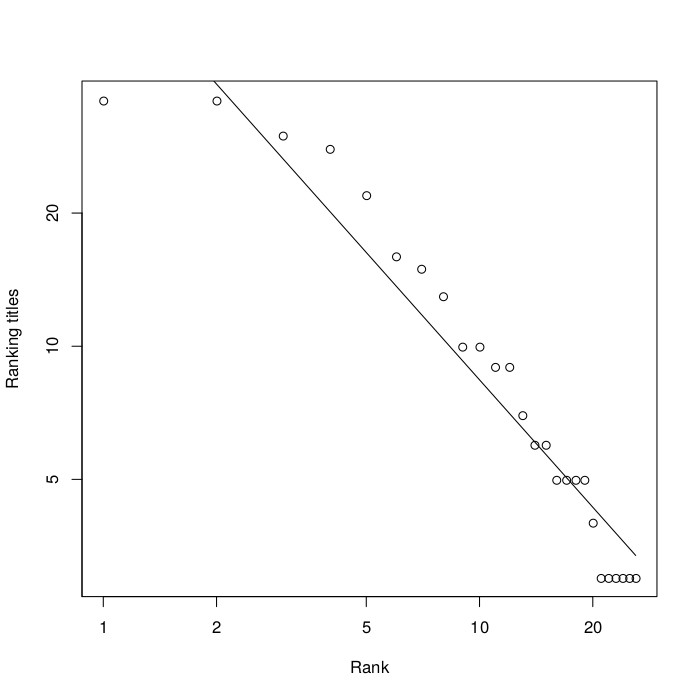
The number of titles (vertical axis) against the rank (horizontal axis). The straight line is a fitted power law.
Finally, if we add up the number of ranking titles of all players from the same country, we get the list shown in the following table
.| Rank | Country | Titles |
|---|---|---|
| 1 | England | 170 |
| 2 | Scotland | 78 |
| 3 | Wales | 37 |
| 4 | Australia | 16 |
| 5 | China | 14 |
| 6 | Northern Ireland | 8 |
| 7 | Republic of Ireland | 7 |
| 8 | Thailand | 4 |
| 9 | Hong Kong | 3 |
| 10 | Canada | 3 |
Plotting the number of titles per country against the rank in the list, as a log-log plot, gives the result as shown in the next figure. The straight line shows the power law that gives the best fit, with an exponent of a=-2.12. The accuracy is much better again in this case: 96%.
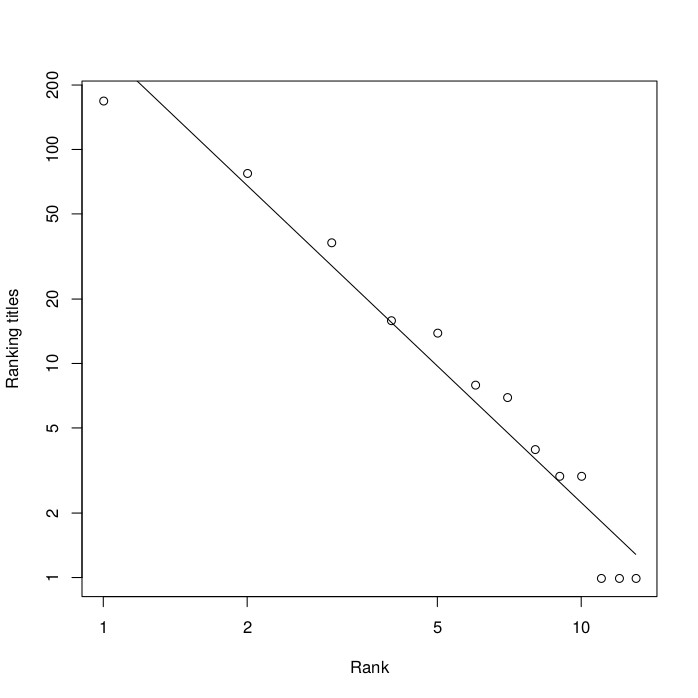
The number of titles per country (vertical axis) against the rank (horizontal axis). The straight line is a fitted power law.
Snooker statistics seem to follow mathematical power laws, just like natural languages, earthquake occurrences, and many types of natural and man-made networks. Why should this be so? Scientists are still arguing about the significance of the occurrence of power laws. On the one hand, there is no particular reason to expect such behavior in many of these situations. On the other hand, the phenomenon seems to be so common that perhaps it has little meaning after all. Either way, it is interesting to see that snooker statistics do indeed follow precise mathematical laws with a high degree of accuracy. I'm curious to see if this year's world championships snooker, with its usual display of power shots, will also produce some additional power laws.
About the author

Wim Hordijk is a computer scientist currently on a fellowship at the Institute for Advanced Study of the University of Amsterdam, The Netherlands. He has worked on many research and computing projects all over the world, mostly focusing on questions related to evolution and the origin of life. More information about his research can be found on his website.