
The mathematical shapes in your brain
This first day of the European Congress of Mathematics (ECM), which took place in Slovenia in June 2021, mathematically captured hearts and minds. Betül Tanbay, who introduced the public lecture by Kathryn Hess at the end of that day, noted that the first lecture of the day had been on mathematical modelling of our hearts. And Hess's lecture was a "mathematical mystery tour of the marvellous intricacy of the brain". We enjoyed Hess's tour so much, we wanted to share some of the ideas from her lecture with you!
Dimension reduction
Our brains are an unimaginably complex network of billions of neurons connected by trillions of synapses. And the complexity becomes even denser when you consider the neurons come in a variety of shapes and sizes and orientations, and there are other factors such as the layers of blood vessels in a brain to consider. "To avoid being overwhelmed by this complexity, we apply a trick familiar to all mathematicians," says Kathryn Hess, professor of mathematics at École Polytechnique Fédérale de Lausanne.
That trick is dimension reduction, finding a simplified representation of the information you are dealing with, and something Hess explains we all instinctively do. Suppose you were lucky enough to be in Slovenia for the ECM in person, and you wanted to travel from your hotel to the main venue. To navigate between these two points you don’t need to know the colour of the buildings or the names of the people who live in the houses. You just need to know when to turn left and right, and the distances between these turns. You can think of it as going from the satellite view of Google maps, which shows you lots of detail, to a street map view, which only shows you the relevant information.
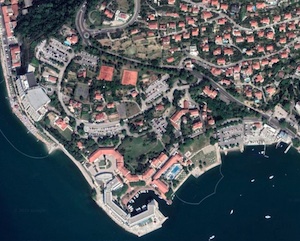
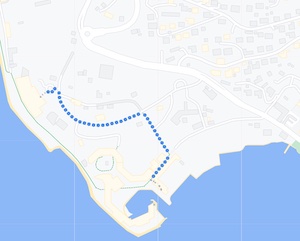
Two views of the area between Piran and Portorož, Slovenia, where the ECM was physically taking place. The satellite view shows gardens, trees, the style of buildings and the location of swimming pools. The street map view shows only the road layout and the route to walk from a hotel apartment to the main Congress venue.
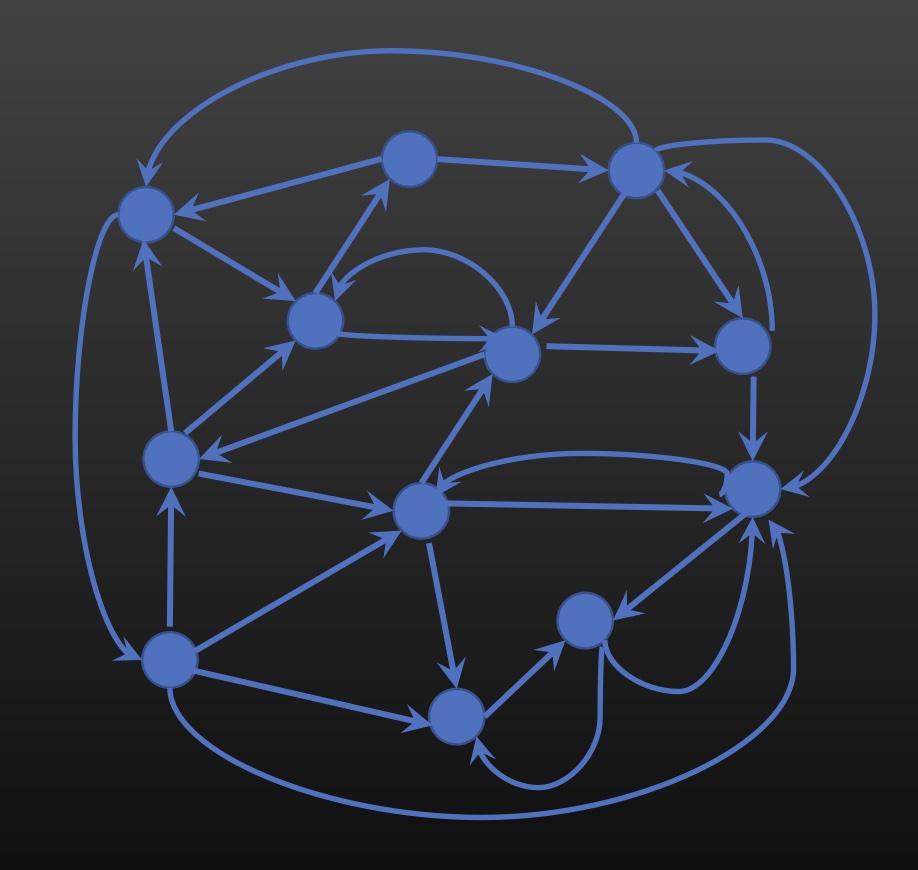
Networks of neurons can be represented by a directed graph like this.(Image: Kathryn Hess)
Hess uses dimension reduction to represent the tangle of neurons in the brain by a graph or network. Each neuron, despite its shape or size, is represented by a node. And a single edge is used to represent any number of synapse connections between two neurons, even though there can be many synapse connections between them (this redundancy in connections is thought to be important in brain function). Because information passes in a definite direction along a synapse (from the axon of one neuron to the dendrites of another) these edges are directed – the arrows show the direction in which information can pass from one neuron to another. And it is possible to have reciprocal edges, where two neurons are connected to each other by two edges each pointing in opposite directions. This directed network provides a simplified structure of brain function.
A touch of reconstruction
Hess's work on the brain has been a collaboration with the Blue Brain Project. "The scale of a model of a human brain is out of reach," says Hess. "With hundreds of billions of neurons the quantity of data is unimaginably vast." Instead, in the quest to reconstruct a mathematical model of a brain the Blue Brain Project are focussing their efforts on the substantially smaller rat brain. But even in a rat brain, Hess says, you are still dealing with a "wild tangle of the network of neurons".
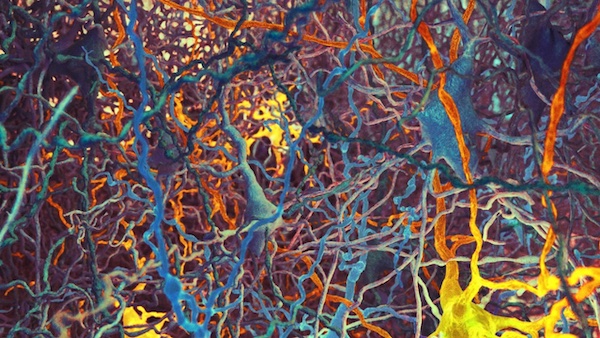
A scientific data visualization of the tangle of different types of neurons in a rat neocortex, by Nicolas Antille, EPFL.
Over the last ten years the Blue Brain project has reconstructed the somatosensory neocortex of a rat brain – this is like a core sample from the surface of the brain deep into the grey matter that forms a microcircuit in the part of a rat's brain that is responsible for the rat's sense of touch. It contains around 30,000 neurons and 8 million connections. This reconstruction process starts by populating the column-shaped space of the microcircuit with a diverse collection of neurons, representing the diversity and number observed in laboratory experiments. These neurons are then connected according to their proximity and information we have about real rat brains.
The algorithm used to reconstruct the microcircuit is stochastic, in that some choices in the algorithm are made probabilistically, and hence the reconstructions produced are different each time it is run. The Blue Brain Project started with the laboratory data from five individual rat brains and an "average" brain (that pooled the data from the individual brains). They then ran the reconstruction process on each of these six datasets seven times, producing seven slightly different reconstructions for each of the individual and the average brain. This produced 42 reconstructed microcircuits in total.
The electrical behaviour of the synapses is then encoded into the reconstructed microcircuits, and the microcircuits can be linked together to form a complete reconstruction of this part of a rat's brain. The ultimate goal is to use reconstructed brains to study neurological disorders, such as Parkinson's disease, and reduce the need for animal testing in areas such as drug development.
Revealing structure

Topology in action
Topology is the area of mathematics that classifies shapes according to how they can be bent or stretched from one to the other, without cutting or tearing. The famous example is that a donut is topologically the same as a coffee cup – if they were made out of pliable clay you could make an increasingly cup shaped dent in one side of the donut, shrinking the loop to the handle, continuously transforming one to the other. What is preserved in this transformation is the hole. The hole in the middle of the donut becomes the hole in the handle of the cup – the hole can't vanish. Topology is interested in what properties – like the hole – are invariant or unchanging under such transformations.
Topology provides the mathematical language of shape and connectivity, and can also describe the emergence of global structures from local constraints. "Topology is an excellent mathematical filter," says Hess, explaining that it can detect the structures and the connectivity in the reconstructed microcircuit and help discern the role these play in brain function.
Hess described a number of approaches of applying the filter of topology to the reconstructed microcircuit and its 31,000 nodes and 8 million connections. One approach Hess and her colleagues used was considering a small collection of relevant and significant subnetworks within the tangle of neurons. The flow of information is important in neural circuits, so they focussed on small feedforward subnetworks, where the information only travels one way through the network.
Topologically these can be described as directed simplices. Simplices are generalisations of triangles to any dimension: a 0-simplex is a point (a node), a 1-simplex is a line (an edge between two nodes), a 2-simplex is the familiar triangle (3 nodes connected by 3 edges), a 3-simplex is a tetrahedron (4 nodes connected by 6 edges) and so on. If you consider simplices whose edges also have a direction, a feed forward network can be represented by a simplex where one node only has outward edges (the input for the network) and one node only has inward edges (the output of the network). (You can read more about simplices here.)
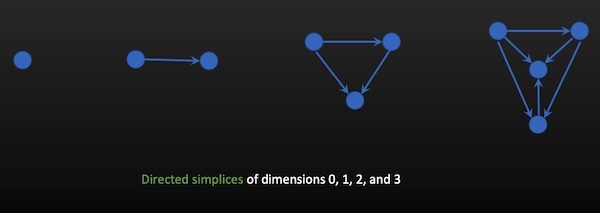
Directed simplices (Image: Kathryn Hess)
The power of topology comes from how very local information, such as the way these small groups of neurons are connected together, can give you important characteristics of the global network. Hess and her colleagues counted the number of these directed simplices of each dimension in the neural microcircuits, and compared it with the equivalent counts of local structures for other types of comparable networks.
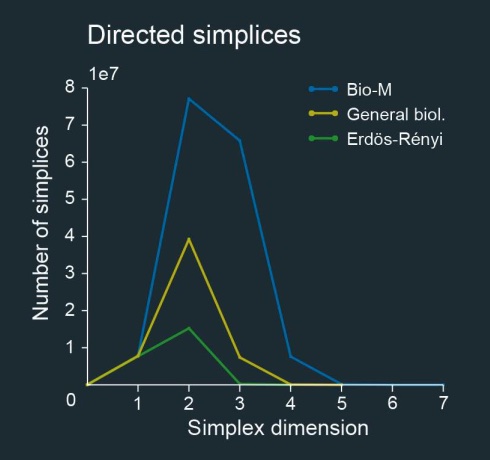
Counts for directed simplices of different dimensions in the Blue Brain neural microcircuits (blue), a random network (green) and a more general biological network (yellow). (Image: Kathryn Hess)
They considered a random network (the green line in the plot) where you start with a similar number of nodes and connect them randomly in such a way the resulting network has a similar number of edges overall, and the nodes themselves have similar numbers of edges, to the neural microcircuit. In this random network there are very few directed simplices, and no directed simplices of dimension 4 or higher. A similar result is found for a more general biological network (the yellow line), that is constructed in a way that doesn't take into account features such as shape or size of the neurons.
The reconstructed neural microcircuit has far higher numbers of directed simplices than the other networks analysed, and contains higher-dimensionsional directed simplices. "The Blue Brain microcircuit has far higher [numbers]," says Hess. "This circuit is far from random." Their work suggests that to enable the necessary coordinated firing behaviour of the neurons, the neurons need to be part of bigger structures such as these higher dimensional simplices.
Counting holes
Thinking back to our donut and coffee cup, the thing they have in common is that they each have one hole. A sphere is not topologically the same as a donut or a coffee cup as it does not have any holes and therefore you can't smoothly transform a sphere to a donut without ripping or cutting it. The number of holes in an object – called its genus – is an important concept in topology as the number of holes is preserved in the smooth transformations. The shape and location of the holes may change but the number of them won't. (You can read more about the importance of holes in topology and one of its applications in maths here.)
The equivalent idea of a hole in a network is a cavity, where simplices overlap on their nodes to form a closed object. You might think of a cavity made of 1-simplices as a window, or 2-cavity. And a cavity of eight 2-simplices as a room, or 3-cavity.
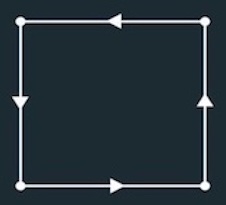
A window, or 2-cavity, made out of four 1-simplices. (Image: Nicolas Antille, EPFL)
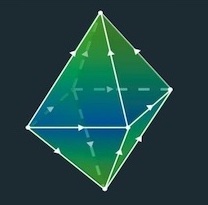
A room, or 3-cavity, made out of eight 2-simplices. (Image: Nicolas Antille, EPFL)
"Cavities in a network are highly non-random, their presence is an indication of structure," says Hess. Hess and her colleagues counted the number of cavities of different dimensions in the 42 different microcircuits reconstructed by the Blue Brain Project. The results of counting the cavities in these different reconstructions illustrate that this topological parameter faithfully reflects the biological reality.
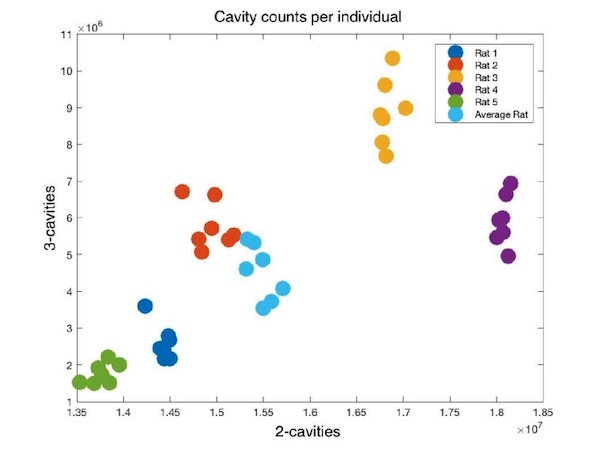
Clustering of topological parameters for biological samples (Image: Kathryn Hess)
The plot to the right shows the number of 2-cavities compared to the number of 3-cavities for each of the 42 reconstructed circuits. The colours represent which individual rat data (or pooled "average" rat data) the reconstructions were based on. The counts of cavities clearly cluster together for the reconstonstructions of each of the individual (and averaged) rat brains. This topological parameter is clearly different for the different rat brains, and the parameter is broadly consistent across all of the reconstructions based on each individual.
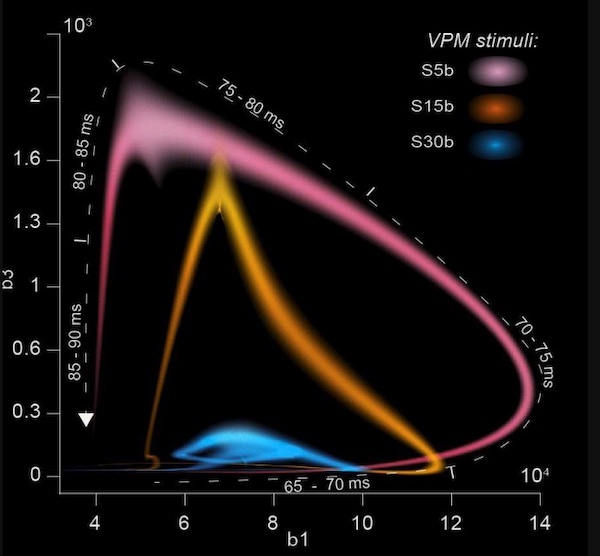
The "swoosh" plot of the number of active 3-cavities (the vertical axis) against active 1-cavities (the horizontal axis). (Image: Kathryn Hess)
The parameters of the number of directed simplices and cavities also provided a method for analysing the wave of electrical activity as it spreads through the neural network. An edge is active if it corresponds to one neuron triggering another. The researchers could observe the evolution of this activity through time, using biologically meaningful time steps, by counting active simplices and cavities at each step. The plot – which Hess and her colleagues call a swoosh – gives a signature of the activity as it loops around the curve in the plot in a counterclockwise fashion.
Hess began her talk by saying she had devoted the first decade of her career to the purest of pure maths – topology, homotopy theory and category theory. Now she is using that same pure mathematics to shed light onto the very stuff that allows us to think up these abstract mathematical ideas. Yet another demonstration of the effectiveness of maths in describing our inner and outer worlds.
About this article
Kathryn Hess is professor of mathematics at École Polytechnique Fédérale de Lausanne. This article is based on her public lecture at the ECM in Slovenia in June 2021. The congress was both in person and virtual, and Rachel Thomas attended virtually from her front room. Thanks to Professor Hess and Nicolas Antille for allowing us to reproduce their images.
Rachel Thomas is Editor of Plus.