
The life of a foraging ant is tedious and boring. It involves nothing more than repeated trips between food sources and the nest. These trips are arduous and long. A single foraging trip of an ant, one of many in a day, might be hundreds of metres. We can put this in human terms by comparing this foraging distance to the body-length of an ant. A 200m journey for an ant represents a distance of over 26,000 body lengths. For a human of average height that would equate to a trip of 30 miles. An ant forager will repeat this journey until she drops dead from exhaustion.
The foraging trips aren't just long, they also follow complex zig-zag paths. So how do ants manage to find their way back home? And how do they manage to do so along a straight line? Their secret lies in a little geometry.
Vector me home
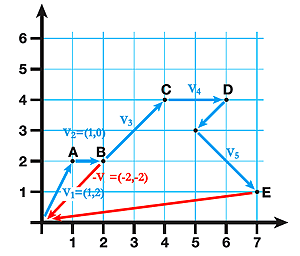
Figure 1: Adding the first two vectors v1 and v2 gives a new vector v that points from the origin to the position after two steps. The same works when you add the first i vectors: the resulting vector points from the origin to your position after i steps.
Ants use a mechanism called path integration, which requires them to measure distances and direction. As an illustration, look at the zig-zag path shown in blue in figure 1, representing a foraging path made up of several segments, starting from the nest at point  Each segment is represented by a vector, for example the first segment is given by the vecor
  The sum of the first
  vectors gives you a vector which points from the origin
  to the current location. The negative of the vector points from the current location straight back to the nest. So to know your way back home, you don't need to remember all the vectors you travelled along — you simply add the current one to the last total and take the negative.
Ants can approximate distances by counting their steps and use the position of the Sun as a compass to keep track of the direction of each segment of an outward foraging route. Through evolution, ants have developed neural circuits in their brain which can take information about distance and direction and produce an output which is an approximation of the appropriate vector maths. The result is a continuously updated home vector. The ants use this information when they have found food or if they are attacked by a predator and need to get back home quick.
Déjà vu
One problem with path integration is that small errors in measuring and adding up vectors accumulate as the ant goes along. So when the ant thinks she should be home she might actually be a small distance away. This is risky because any time wasted increases the chances of becoming dehydrated or being eaten by a predator. She needs to locate the often inconspicuous nest entrance as quickly as possible. To do this she uses her visual sense and learns about the appearance of the world around her nest.
In humans making sense of a visual scene takes a significant amount of brainpower. We use vision to identify familiar buildings and landmarks to find our way around familiar areas. Our brains have to separate the world into objects that are important and those that don't provide reliable and useful information. These objects have to be labelled and stored in a mental map that can then be utilised in future to work out where you are and where you want to go.
Ants don't have enough brainpower to keep a large mental map representing the positions of all the landmarks in their environment. And anyway, they have such low resolution vision that it is almost impossible for them to recognise objects. Like all eyes, ants' eyes are made up of lots of photoreceptors, so the image produced by an eye is like that of a digital camera — it's made up of lots of pixels. Like with a digital camera, the quality of the image produced by an animal's vision is related to the number of photoreceptors (pixels) it has. Humans have millions of photoreceptors and the majority are focussed on a small region of the world in the centre of our visual field, which allows us to see fine details.
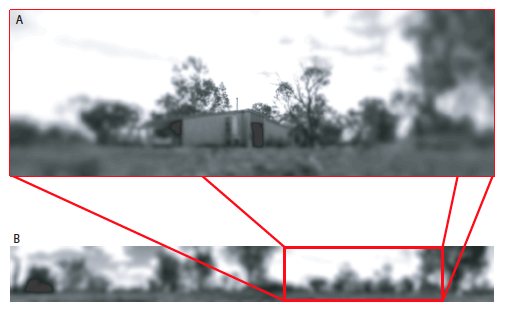
Figure 2: Image A shows the world as seen by a human eye. The human field of view is quite large, almost 120° wide. However, we only have high-resolution vision at the centre of our visual field, which we make up for by moving our eyes. Image B shows an ant's eye view of the world. Ants have a horizontal field of view spanning almost 360°, but with homogenous low resolution. Notice how you cannot recognise the house in the ant's eye image. This picture shows a vertical angle of 45°, but ants can see directly above themselves as well, because they need to look at the sky to gain compass information.
Ants have many fewer photoreceptors than humans and to make matters worse, their field of view is much larger. With a vision system like this it would be almost impossible for ants to reliably identify objects to use for landmarks, especially since their world is made of similar looking trees and shrubs. Figure 2 gives a representative idea of how the world might appear to an ant and a human. Note how hard it would be to identify a particular tree from the ant's eye view of the world.
The goal snapshot
Fortunately, to find your way home using vision, you don't have to be able to identify landmarks. All you have to be able to do is determine the difference between two pictures. Have a look at the three photographs in figure 3. Which photograph, out of  and
and  is most similar to photograph
  ? And how can we answer this question scientifically? For paper photographs we could ask whether the photos appear to contain the same trees and shrubs (they all do), or whether the average brightness is similar (it is). However, for digital versions of the photos, it becomes possible to make a precise mathematical comparison. For black and white photos, like
  and the colour of each pixel in the image is specified by a number between 0 and 255. The value of 0 corresponds to a black pixel and the value 255 to a white pixel.
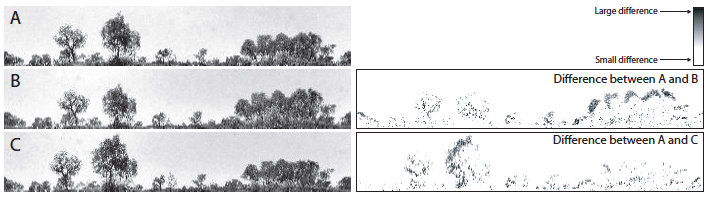
Figure 3: The differences between images A, B and C.
Using these colour values we can now compare each pixel in one image to the pixel in the same position in the other image and combine the scores to get an average difference measure for the whole image. For a pair of corresponding pixels with values  and
and  we first calculate the difference between their values and square it (we square the difference to make sure it is always positive):
![\[ (a-b)^2. \]](/MI/54fe5b36dc5d0e19068bb50e6c0dd066/images/img-0003.png) |
We then take the average of this squared difference over all pixels and then take the square root of that sum. So if the pictures  and
and  have
have  pixels each with values
  ,
,  , ... ,
  for picture and values
  ,
,  , ... ,
  for picture we get:
![\[ \sqrt{\frac{(a_1-b_1)^2+(a_2-b_2)^2+...+(a_{n}-b_{n})^2}{n}}. \]](/MI/54fe5b36dc5d0e19068bb50e6c0dd066/images/img-0013.png) |
This measure is called the root mean square (RMS), describing the overall difference between the two images. Now we can answer our question objectively: which image is most like ? The RMS difference between and is approximately 6.7 and the RMS difference between  and is 6.5. Therefore is more similar to than
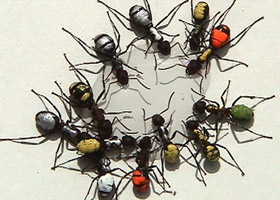
Ants used in research are painted so that researchers can keep track of individuals. This doesn't harm them! Photo: Stuart Robinson.
Now suppose you take a photograph of a scene, then move a small distance and take another photo. The two photos will be similar but not identical. If you move again and take another picture, then the third picture will be more similar to the second picture than to the first picture. This is a basic property of how the appearance of the world changes as you move: the similarity between two images decreases as you increase the distance between the locations where the images were taken. Ants use this property of visual scenes to get back to an important location. They remember what the world looked like from the location they wish to return to later. This remembered view is called the goal snapshot. And there's a simple strategy that will take the ant back to the location from where she took that snapshot.
First, neural processes in the ant's brain perform a calculation similar to that described above and compare what the world looks like currently with the remembered snapshot. The ant then tries to reduce this score to zero (see figure 4), because a difference of 0 means that the ant is back at the goal (nest). Each time she moves she can observe if the image difference score (IDS) reduces. If it goes down, she continues in the same direction. If it goes up, then she is getting further away from the goal, and so she should choose a new direction.
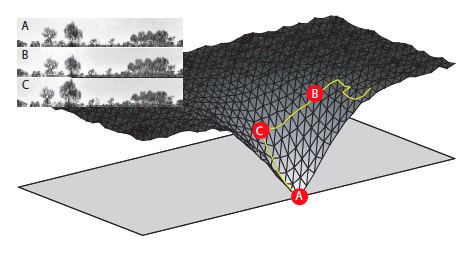
Figure 4: To get back to the location where the reference image was taken an ant has to detect the gradient in the image difference score and move down it. A simple way of doing this is called the RunDown algorithm. To descend the gradient, you first choose a random direction. If the IDS reduces, then you continue in that direction, if the IDS increases then you turn by 90º and repeat the process. The path shown gives one possible route to the goal using RunDown.
With this type of simple strategy the ant will always end up at her goal. The beauty is that she doesn't have to calculate where she is, she just repeats the simple rule until she gets home. Neither does she have to identify objects within the world, she can use the raw visual input. So if you are an ant, you can find your way home without ever needing to know where you are or what you can see.
About the authors
 Paul Graham |
Paul and Andy study the navigational abilities of insects at the University of Sussex; they are interested in how small brained animals can produce smart behaviour and whether that behaviour can be replicated in robots. Their research on insect navigation was presented at the Royal Society Science Summer Exhibition in 2010. The exhibit was also part of the Maths Inside project, a collaboration of Plus and the Mathematics Promotion Unit (run by the London Mathematical Society and the Institute of Mathematics and its Applications), which revealed the maths behind four specially chosen exhibits at the Royal Society Summer Science Exhibition. Click here to find out more about the project and to read articles accompanying other exhibits. |
 Andy Philippides |
Comments
Absolutely amazing
I really dislike math but this was absolutely amazing. I cant even put my thoughts into words, very well written and never lost me, kept me interested and engaged.
Thank you for writing this!