Understanding uncertainty: A league table lottery
This is the first instalment of David Spiegelhalter's regular column called Understanding uncertainty.
League tables are controversial and for good reason. Few things are simple enough to be measured by a single outcome like, for example, the number of exam passes or successful heart operations. But even if we do accept a single yardstick, we haven't yet reckoned with chance, which by itself can produce apparent patterns to delight any tabloid editor.
Take the National Lottery as an example. As we'll see in a moment, a league table based on the whole history of the lottery appears to show that some numbers are preferentially drawn. Other numbers don't come up for ages. Clear evidence for cheating, or even the hand of god? Not necessarily; in fact the league table, taken at face-value, is completely spurious. What is at work here is simply chance. Let's have a look at the details.
Lucky numbers and unfortunate gaps
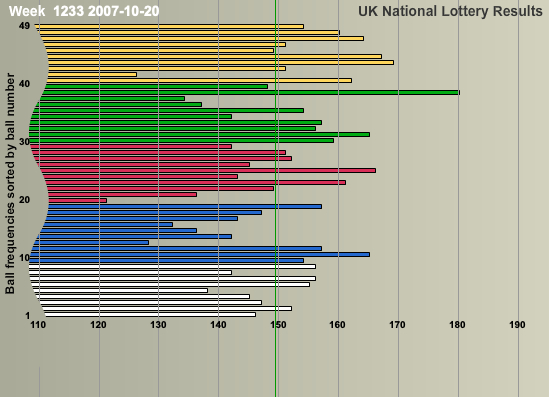
The UK National Lottery began on the 19th of November 1994 and there had been 1240 draws up to the 20th of October 2007. Six balls are randomly drawn from a set of forty-nine numbered balls. If you correctly predict the six numbers, you get a share of the jackpot. The figure below shows how often each of the 49 numbers came up in the first 1240 draws.
We can take another angle on this by looking at the gap between each time a number comes up. The animation below keeps track of each time a specific number is not drawn. The animation starts from the beginning of 2000.
If you look carefully from the start of 2000, you'll see that the longest gap observed is 72, for number 17, which appeared in draw 435 on the 23rd of February 2000, but did not appear again until draw 508 on the 4th of November 2000. A back-of-the-envelope calculation shows that such a long gap is rare indeed. The chance of a particular number occurring in a single draw is 6/49, which means that the probability of a number not being picked is 1-6/49=43/49. The chance of this happening 72 times in a row is thus (43/49)72, which is roughly 0.000082, or 1 in 12,500!
What our league tables have shown us so far — a lucky number 38 and a gap of improbable size — doesn't seem to sit well with the assumption that the lottery is truly random. This is the sticky point at which you might be tempted to suspect the lottery of being rigged, or evoke cosmic interference. But with a little mathematical stamina it's possible to find out whether this is still within the realms of pure chance. So take a deep breath and sharpen your pencil.
The distribution of the number of appearances of each number
First you need to define a theoretical probability distribution based on the assumption that the lottery is random. Let $m$ stand for the number of balls chosen at each draw and $M$ for the number of balls in the bag, so in our case $n=6$ and $M=49$. If the numbers are chosen at random, then for each the chance of being drawn is $p = m/M$, so here $p=6/49$. The chance of a number not being chosen at a particular draw is $1-p$.
To work out the probability that in $D$ draws a particular number is drawn exactly $x$ times, you have to consider three factors. The first is that the number was picked $x$ times. The chance of this is $p^x$. The second is that it was not picked $D-x$ times. The chance of this is $(1-p)^{D-x}$. So $p^x \times (1-p)^{D-x}$ is the chance of a particular sequence of $x$ picks and $D-x$ non-picks being observed. The third thing to notice is that overall there are $$\left(\begin {array}{c} D \\ x \end{array} \right) = \frac{D!}{(D-x)!x!}$$ different sequences of $x$ picks and $D-x$ non-picks (here $D! = D \times (D-1) \times ... \times 2 \times 1$). Each of these contributes an amount of $p^x \times (1-p)^{D-x}$ to the overall chance. Therefore, the chance that in $D$ draws our number is drawn exactly $x$ times is: $$ P(Number\; drawn \; x \; times \; in\; D\; draws) =\left(\begin {array}{c} D \\ x \end{array} \right) p^x (1-p)^{D-x}.$$ This is a binomial distribution with parameters $p$ and $D$. The distribution has mean $Dp$ and variance $Dp(1-p)$. We're interested in large values of $D$ here and it turns out that for these values the binomial distribution can be approximated by a normal distribution with matching mean and variance.
Below we see the final observed distribution with an approximate theoretical distribution superimposed. The fit looks good, suggesting that there is no real preference for particular numbers. The lucky number 38 is no evidence of bias.
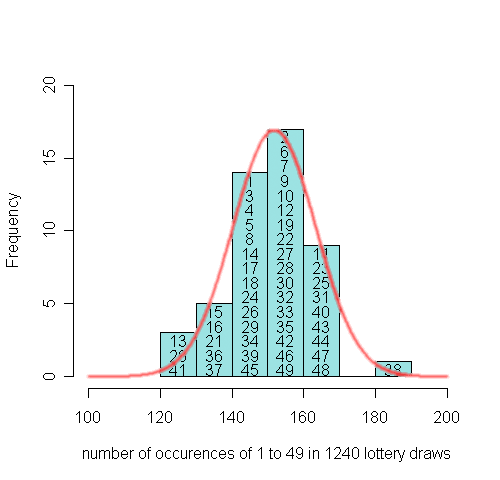
The observed and the theoretical distribution.
The distribution of gaps between a number's appearances
You can work out the theoretical distribution of gaps between numbers in a similar way. Consider a particular number $j$. Label a draw a success if number $j$ is drawn and a failure otherwise. As before, the chance of a success is $p=6/49$. Let $X$ stand for the number of failures before the first success, in other words the gap before $j$ is drawn again. The chance of $X$ taking on any particular value $x$ is the same as the chance of observing a series of $x$ failures followed by a single success, so that $$P(X=x) = (1-p)^x p.$$ This is the geometric distribution. Its mean is $1/p - 1 = 49/6-1= 7.16$, so the mean gap length is around 7. (Note that this distribution is sometimes defined as the time until the first success, which here corresponds to Y=X+1.) The histogram below shows the distribution of all the gaps, with the theoretical geometric distribution superimposed. The gaps are divided into those below and above 40, so that the large gaps are clearly displayed: the theoretical distribution seems to fit the observed distribution well, although there are inevitably some jagged bits in the tail.
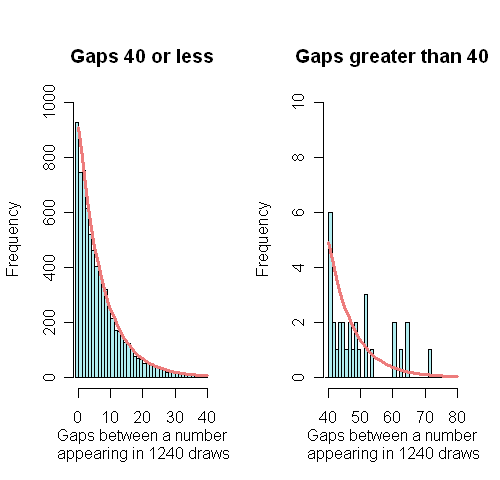
The observed and the theoretical distribution of gaps.
The maximum gap in the whole lottery history
But what about that maximum gap of 72, which we worked out to be extremely unlikely? It turns out that we asked slightly the wrong question, namely: "The number 17 has just been drawn, what is the chance that it will not be drawn within the next 72 draws?" In reality, though, we are looking at the results of 1240 draws, rather than just 72, and we are not interested specifically in the number 17. What we should have asked is: "After 1240 draws, what is the chance that any of the gaps between two draws of the same number is greater than 72?".
To work this out, we first need to know how many gaps there are in total. There have been 1240 draws, each featuring 6 numbers, so altogether 1240 × 6 = 7440 numbers have been drawn. Each time a number appears, there is a corresponding gap since it last appeared (this includes the initial gap until each number is drawn for the first time). Our question now becomes: "What is the chance that the longest of these 7440 gaps is at least 72?".
We can estimate this chance using our distribution: $$ P(maximum\; gap \geq 72) = 1-P(maximum\; gap < 72) = 1-P(all \; gaps < 72) \approx 1-P(X<72)^{7440}.$$ The last part of the equation holds because the probability that all gaps are less than 72 is approximately the product of 7440 identical probabilities that a single gap is less than 72. (The result is only approximate because there is some slight dependence between the gaps due to there always being 6 numbers in each draw - we shall check how good this approximation is later). Now $$1-P(X<72)^{7440} = 1-(1-P(X \geq 72))^{7440} = 1-(1-0.000082)^{7440} \approx 0.46.$$
This result suggests that a maximum gap of length 72 is not in the least surprising. In fact, there nearly is a fifty-fifty chance of a gap of at least that length occurring in 1240 lottery draws.
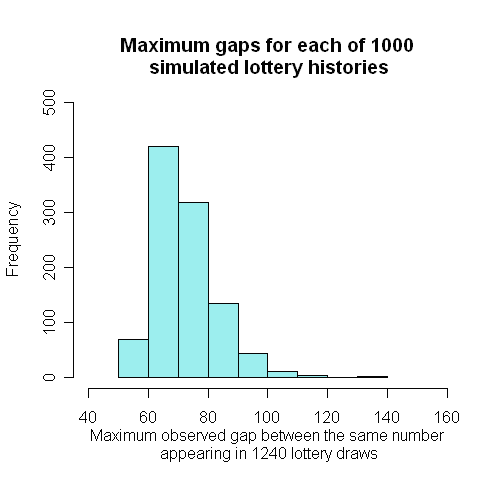
To check the accuracy of this result we can simulate "fictional" lottery histories on a computer, by picking 6 different numbers at random from 1 to 49, and then repeating this process 1240 times. The software we use contains random number generators that should ensure that each number really does have an equal chance of being chosen. We simulated 1000 full lottery histories and found the longest gap in each history which had the distribution shown below: 470 (47%) out of 1000 were 72 or more, which is similar to our approximate theoretical probability of 0.46. Good!
Testing for bias in the lottery
The good fit between the theoretical and observed distributions suggests that what we've observed in the 1240 draws is in keeping with the assumption that the lottery is random. Yet, the distributions do differ. How large can we allow this difference to become before we start to worry? In other words, how confident can we be of our conclusion that the lottery is random? Probability theory has an answer to this question too. In fact, there are many test statistics designed to identify different ways in which the lottery draws may not be entirely random. Let's consider one of the simplest.
The binomial distribution above says that after $D$ draws we expect any particular number $j$ to have occurred $E_j = Dp = Dm/M$ times. In the UK lottery this corresponds to $6D/49$, approximately $D/8$. So, for example, after 1240 draws we would expect each number to have been chosen around $1240 \times 6 / 49 = 122.4$ times. Now add up the total number of times each number has occurred after $D$ draws and label these totals $O_1$, $O_2$, etc, up to $O_{49}$.
For each number $j$ the expression $Y_j = (O_j - E_j)^2/E_j $ is a measure of the discrepancy between what's observed and what's expected. If we add the $Y_j$ for the 49 values of $j$, we get an overall measure of discrepancy - it's called the chi-squared statistic and usually denoted by $\chi^2$. To match our set-up we need to multiply this standard chi-squared statistic by the small amount $48/43$. This is because, as already mentioned above, the totals are not quite independent. It's rather a tricky bit of statistical theory and we won't go into it here.
Just as it was possible to work out a theoretical distribution of the occurrences of each number based on the assumption that the lottery is random, it is possible to work out a theoretical distribution of $\chi^2$. It is called a chi-squared distribution with, in this case, $M-1 = 48$ degrees of freedom. It tells us the chance of observing our particular value for $\chi^2,$ assuming that the lottery is indeed random (and assuming that all the balls being drawn are statistically independent). If this chance is low, say less than 0.05, or 5\%, then there's reason to worry.
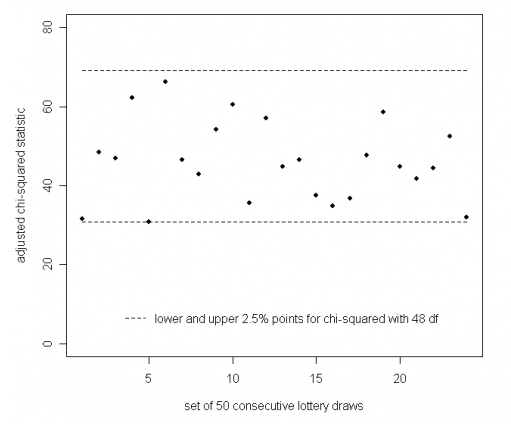
We won't say much about the chi-squared distribution itself here. All we'll say is that in our particular case it tells us that our observed value of $\chi^2$ should be somewhere in the region of 48. It also tells us that the chance of our observed value being greater than 69 or less than 38.9 is only 0.05, or 5\%, so we should watch out for observed values in those regions. The histogram below shows the observed values of the statistic where the draws have been combined in groups of fifty, so in each case $D=50$. As it turns out, all observed values lie between the dotted lines at 60 and 38.9 — we can be reasonably confident that the lottery is indeed random.
Thus, the patterns we spotted in the lottery league table were red herrings. But what about those league tables that do not arise from pure chance? Can we separate chance from meaningful information in these cases? This is what we'll explore in the next issue of Plus. Our example will be the Premier League!
Further reading
This article is based on an idea by Norman Fenton on considering the lottery results as a league table. John Haigh has also written about probability and the National Lottery, see Plus articles The UK National Lottery - a guide for beginners and Running a lottery - for beginners.
If you want to try your own analyses, a spreadsheet with the full lottery history can be downloaded from the main UK National lottery site.
To find out more about statistical modelling and about the (mis)use of statistics in the media, read this issue's Plus articles An almighty coincidence and The tiger that isn't.
About the authors
 |
David Spiegelhalter is Winton Professor of the Public Understanding of Risk at the University of Cambridge. Mike Pearson created the animations for this article. Mike, David and the rest of their team are currently setting up a new website called Understanding uncertainty which will inform the public about all issues involving risk and uncertainty. The website will be launched in spring 2008. |
 |
Comments
Anonymous
Hi David and Mike,
Your statistical information is very detailed, and I know exactly where you are coming from, in that, if I were to pick 38 as my core number, I could be out of luck, the balance could right it'self, and we must remember that statistically all numbers have an equal chance, but this is not absolutely true, it depends on what rank and order the numbers went into the machine, and also the amount of time the balls were tumbled before being selected, and there is also a bias in computer random number generation, because it depends on what integer the processor dealt with the very last time numbers were generated on it. So there's some more work for both of you to look into. Hmmp, I still need to win the lottery though! Have fun.
Yours Faithfully,
Geoffrey Taylor.
geoffrey731@gmail.com
Anonymous
hi David and Mike,
under the heading:
"The distribution of the number of appearances of each number"
You appear to assume that the number of balls is m (6 for UK lottery) and on this basis you are proceeding to prove that the distribution is binomial. The implicit assumption here is that one is drawing a sample of 6 balls, whereas in reality "one is drawing one ball at a time without substitution, up to the number of m (6 for UK lottery)". The implication is that whereas the former assumption leads to a BINOMIAL DISTN, the latter reality would lead to some other distribution ( HYPERGEOMETRIC ???).
Although the first assumption may be justified for the purpose of the study at hand, I would appreciate your comments... of course I realise that my remarks come a few years later; nevertheless lottery seems to remain a very lively topic
Regards
Tassos Chryssafis (tchryssafis@hotmail.com and tassos@talktalk.net)
James Dixon
Hi Mike and David, I have been working through your article, in the subject section there is an equation 1240 x 6/49 = 122.4. When I calculated it I got 151.8. Am I missing something?