Understanding uncertainty: How long will you live?
None of us are going to last forever. Our prospects depend on our sex, our age, our lifestyle, our genes, and many other personal factors both known and unknown. Even with all this information we're all uncertain about the exact date of our death. But by looking at large groups of people who are like us, we can count how many die each year and so get an idea of the risks we face and how long we might live. This article will tell you how this is done. By the end of it, you'll be able to calculate your own life expectancy, based on some of your lifestyle choices.
The animation below shows mortality figures collected in the years from 1982 to 2006. It's these kind of figures that are used to work out what risks we face and when we're likely to die.
Each line represents a person's life — the line stops growing when the person dies. Sort by age will arrange the lines in order of age (the oldest at the bottom). Hide the living will only show those who are dead. Ticking Pushing daisies will alert you every time a person dies.
So how are these figures used? At the heart of mortality statistics lies something called hazard, also known by the beautiful name the force of mortality.
The force of mortality
The term hazard denotes the fraction of people who die before their next birthday. If applied to individuals, the hazard curve shows the annual risk of death, given the individual has survived up to now — it's a conditional probability. In the animation above, the hazard for each person is given in red. Hazard curves typically have a "bath-tub" shape — a fairly high early risk of death in the first year, then a period of very low risk, and then a long but steady increase in risk into old age.
We can obtain an estimate of the current hazards in the country by seeing what percentage of, say, two-year-old female children die each year. In 2006 this was around 0.0186%, and this percentage risk is shown in the animation below. The figures also show that 0.455% female babies die in their first year, and 25.4% of 96-year old women die before their 97th birthday. (When you pass your mouse over the curve, you will see the percentage risk for the corresponding age, rounded to one decimal place.)
If you move the slider you can see how the hazard has changed over the last 25 years: the number of babies that die in their first year has halved, and the hazard for people in the 60s and 70s has dropped a lot. But people in their 90s don't seem to have benefited from all the improvements in lifestyle and healthcare. Ticking Log scale will present a scaled version of the curve which accentuates the bath-tub shape.
Survival curves
Survival curves show the percentage of people of each sex who will reach each successive birthday, assuming the average risks currently faced in the UK. This curve steadily declines until all are dead. If you are willing to ignore all your personal information and simply consider yourself as "average", then this assesses your chance of being alive at each year in the future. The animation below shows a survival curve. You can find your expected age of death by entering your age and sex, and use the slider to see how this changed over the years.
From hazard to survival
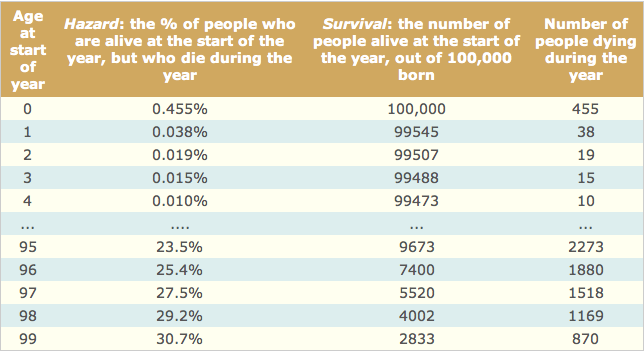
We can get from hazard to survival curves by applying the percentage risk given by the hazard curve to an imaginary group of people born in a specific year. Let's see what we would expect to happen to 100,000 females born in 2006. The hazard data tell us that we would expect 455 (0.455% of 100,000) to die in their first year of life, leaving
100,000 - 455 = 99,545. The hazard percentage is shown in the second column of the table below. The third column shows the number expected to be alive at the start of the corresponding year of life and the final column shows the number expected to die during that year of life. Of these 99,545, we expect 0.038% (38) to die before their second birthday, leaving 99,507, and so on. The 100,000
steadily decrease, until there are 2,833 expected to reach their 99th birthday. Of these, 30.7% (870) are expected to die before their 100th birthday, leaving 2,833 - 870 = 1,967 (around 2% of the original 100,000) reaching 100.
The third column, converted into percentages, gives the numbers making up a survival curve for females born in 2006: it shows the percentage of people reaching each birthday. To get the survival curve starting at a specific age, say for people who have already reached 54, we just need to look at the part of the table starting at 54, and rescale the third column so that it starts at 100,000.
Since we apply the same hazard percentages (those of 2006) to each year of life, all this assumes that the hazards do not change in the future. This is of course is very unlikely, and so the survival curves should really be adjusted for whatever benefits to health can be expected in future.
Life expectancy
The final column of the Table shows the number of people expected to die at each age, and we can use this to calculate the average length of life, or life expectancy.
Start by assuming (unrealistically) that everyone dies on their birthday. Then out of 100,000 females born, 455 will live 0 years, 38 will live 1 year, 19 will live 2 years, etc, and so the average length of life is $$\frac{(455 \times 0) + (38 \times 1) + (19 \times 2) + ... }{100,000} = 80.8$$
Now it would be more realistic to assume that on average people die half-way between their birthdays, and so we should add 6 months onto this figure to get 81.3 years. This is only approximate and more accurate methods can be used.
Relative risk
So far we have only considered age and sex in our calculations. But if we gather more information about the individuals that make up our figures, we can calculate survival curves and life expectancy that take lifestyle issues into account. The animation below is based on data from the UK life-tables from 1982 to 2006 [1], presented both as hazard and survival curves, as well as the recent results from the Norfolk EPIC study by Khaw and colleagues [2] on health behaviour and mortality. The latter study makes the assumption that lifestyles are not really established until the age of 45 — drinking heavily doesn't make that much of a difference until you've done it for a long time — so the animation only looks at people over 45.
Enter your details and see how long you'll live!
References
- UK Interim Life Tables 1982-2006, Office for National Statistics (ONS), Government Actuary's Department (GAD), (2007)
- Combined Impact of Health Behaviours and Mortality in Men and Women: The EPIC-Norfolk Prospective Population Study, Khaw KT, Wareham N, Bingham S, Welch A, Luben R, et al., PLoS Medicine, Volume 5, Issue 1, (2008)
About the author

David Spiegelhalter is Winton Professor of the Public Understanding of Risk at the University of Cambridge. David his team run a new website called Understanding uncertainty, which informs the public about all issues involving risk and uncertainty.
Comments
Anonymous
I'm in the Medicare Insurance Business. If you are an agent calculating renewals, mortality rates have to be considered. Will it make any difference in my life? No, but it's interesting and I love statistics. I'll have to make sure I'm not heavily skewed toward 95 year-olds. But then again, I'm not that young either. Maybe somebody is doing some calculating on me!
Anonymous
Thanks so much this is very interesting. I have always been curious about this.
I would be useful to add D(A) = Exp( Age of Death | Your current age is A).
D(A)-A then would be the number of years you have left to live.
$40,000 * (D(A)-A) would then the expect amount for you to spend (assuming $40,000 a year).
Some sort of risk analysis. How much would I need if the probability I run out is at most 5%.
Thanks
Anonymous
Thanks for the great work on putting this into graphical format.
The first graph I had trouble understanding what the data was doing but the rest were great!!.
Anonymous
A really good and understandable document.
I would have liked to download some of the distributions but I get an error message that the page is unavailable.
Alan
Anonymous
Thank you very much for this helpful article, I have searched around this topic for some time and this had the clearest information available. In the final graph, is the data not available to take statistics given survival to younger ages, or does lifestyle simply not make a significant statistical difference at younger ages?
Anonymous
I came for the percentages and left with a fuller understanding of the stats of survival.