The best medicine?
Hard questions
There are other diagnostic tools
[Image DHD Photo Gallery]
When did you or one of your family last go to the doctor? It might have been for something unpleasant but soon cured, like a sprained ankle or a sore throat, for something more serious like a heart attack or a cancer, or for a long-standing problem like asthma or multiple sclerosis. Whatever the medical problem, there are questions that you would like your doctor to answer. The immediate questions most patients ask are:
- What is wrong with me?
- How should it be treated?
- What does the future hold?
With more reflection, many patients ask two further questions:
- Why me?
- Could it have been prevented?
Each of these questions seems like a medical question. But as we shall find out, each can only be answered by using good statistics, based on rigorous mathematics.
What is wrong with me?
When a patient visits the doctor with a new problem, they describe their symptoms. The doctor may do some further tests before making a diagnosis. The difficulty is that many symptoms such as headaches, cough, rashes and so on, can be caused by many different diseases, and so the doctor's task is to make a diagnosis from all the possible causes. This is really a problem of what mathematicians know as conditional probability.
Consider a woman who goes to see her doctor about a lump in her breast, worried it might be a cancer. In fact, she should be cautiously positive, because huge amounts of past data tell us that 9 out of 10 breast lumps are not cancer (http://www.cancerresearchuk.org/aboutcancer), so, before any medical investigations begin, we have
Prob (not breast cancer | lump) =0.9,
which, since the total probability over all the possibilities always adds up to 1, tells us that
Prob (breast cancer | lump) = 0.1.
Although there is only a small chance that the lump is cancerous, breast cancer is serious, so the doctor will organise further tests to refine these probabilities, until a firm enough diagnosis is reached either to begin treatment, or to reassure the woman. In many instances, the doctor will do this at a fairly informal level: "You've probably got nothing to worry about, but I'm going to send you for some tests just to be on the safe side." But when researchers are investigating new tests, these have to be subjected to rigorous statistical assessment before being widely adopted, in order to avoid the later possibility of significant rates of seriously misleading diagnoses.
How should it be treated?
How should it be treated?
[Image DHD Photo Gallery]
If you had cancer, would you be willing to try a new treatment not used before in clinical practice? If you had multiple sclerosis, would you be prepared to take cannabis to help relieve the symptoms? Or would you expect your doctor to tell you what to do? How do doctors know what to advise? There are new treatments being developed all the time. Are new treatments always best?
Fighting cancer
There are three main ways to deal with cancer: cut it out, blast it away, or poison it. Doctors call these three options "surgery", "radiotherapy" and "chemotherapy". Depending on the site and stage of the cancer, a patient may receive one, two or even all three of these treatments. Most radiotherapy is given using photon particles. But some doctors had the idea that using neutron particles, which are bigger and heavier, might be a better way to treat some cancers.How could they find out whether this is true? How could they conduct a fair test of the new treatment (neutrons) against the standard treatment (photons)? The answer was to conduct an experiment, called a randomized clinical trial. Patients with cancers in their pelvis (bladder, prostrate, rectum and bladder), whose doctors decided they needed radiotherapy, were asked to take part. If they agreed, they were randomized to receive treatment either with photons or with neutrons. This meant that half the patients received one treatment, half the other, with the choice being made by a randomisation method, just like tossing a fair coin. That way there could be no bias in who received what treatment. Patients were then followed up to see how long they lived.
The graph above shows the "survival curves", which shows how long patients survived in each group. Expressing this using conditional probabilities,
Prob (surviving at least 1 year | photons) = 0.6;
Prob (surviving at least 1 year | neutrons) = 0.5.
In other words, one-year survival on the new treatment, neutrons, is actually worse than that on the standard treatment photons. Because of this the study was stopped early, and no more patients were recruited. But before stopping the study, and concluding that the new treatment should not be used for these cancers, there was a lot of careful statistical work to verify that this really was a fair test with comparable patients, and that the unexpected result was not just due to random variation.
Cancer treatment is being improved largely by small incremental changes in each type of treatment, and careful assessments of under what circumstances combination treatment would be beneficial. Clinical trials are the only way to sort out which new ideas for treatment are beneficial and which are actually harmful.
Using cannabis to treat multiple sclerosis
Carrying out a fair test of whether cannabis can help people with multiple sclerosis is, in many ways, even more challenging. With cancer, the outcome is often death, which is easy to define, and therefore to count and analyse. Multiple sclerosis does not usually cause people to die, but can produce many different symptoms, some serious, some not so serious, which can fluctuate wildly over time. It is very difficult to determine what has genuinely been the response to treatment, and therefore even more important to conduct a rigorous study. A randomized controlled trial is currently under way to establish whether cannabis really can help multiple sclerosis patients. Patients are being randomized to receive either active derivatives of cannabis, or a placebo. A placebo looks the same, but has no active ingredient. It is used to ensure a fair test, by helping disentangle the effects of cannabis itself from the effects of being in the study. Patients are being monitored for spasticity, pain and tremor, problems with bladder control, and quality of life. The measurement of each of these requires carefully developed scoring systems, and the analysis of the trial will pose interesting statistical problems. (You can find out more about the trial here.)Nurturing premature babies
The treatment of very premature babies is an area that has benefited enormously from many rigorous studies. Because of breathing problems they are sometimes given "surfactant" which helps protect immature lungs. Several randomized trials have been carried to evaluate their benefits. The individual trials were mainly too small to be conclusive about neonatal mortality, that is, deaths within one month. The figure shows all of these studies. It plots"relative risk" =Prob (death | synthetic surfactant group)/Prob (death | control group)
It also shows a 95% "confidence interval", which expresses the uncertainty about where the true risk lies. For most of the individual studies, it seems the true relative risk could be 1, which means we cannot be sure which treatment is best. However, looking across all the studies, the evidence seems to stack up in one direction.
A statistical technique called meta-analysis provides a logical way of combining all the evidence in a number of different studies by appropriately weighting the information in each. This shows clearly that synthetic surfactants reduce deaths in premature babies compared to control. A relative risk of 0.7 means that we estimate that the risk of death on synthetic surfactant is only 70% of that on control. Moreover, the 95% interval for the combined estimate is quite narrow, meaning we can be reasonably sure that the true relative risk is between 0.58 and 0.85. Clever statistics were needed to tease out this subtle but important effect. Other examples of meta-analysis in medicine can be found on www.cochrane.org.
Although the principles behind clinical trials are very simple, the variety of clinical areas in which they are used presents fascinating statistical challenges in all aspects of design, analysis and interpretation.
What does the future hold?
To answer a particular patient asking this question requires careful understanding of how individual characteristics help predict outcome. We really want to be able to estimate, for example,
Prob (returning to playing football within a month of a
sprained ankle | female, aged 17, previously fit).
For this example, most doctors could produce reasonable estimates based on clinical experience. However, in the cancer trial we looked at groups of patients with fairly advanced cancers. But if you study the survival curve carefully, it may have struck you that some patients did not even survive a month, whereas others were still alive five years later. So, for an individual, we might want to know
Prob (surviving at least 12 months| age, sex, smoking habits, stage of cancer, treatment),
or, more generally,
Prob (surviving at least t months | age, sex, smoking habits, stage of cancer, treatment).
For some cancers, especially if they are diagnosed at a late stage, it might be appropriate to focus on t=3, or t=6, whereas for many cancers such as breast and cervix it is more usual to quote 5 year survival rates (t=60).
Calculating these estimates for all the different cancers is extremely challenging, but it can be done by carefully and systematically collecting data on patients and their outcomes. These data require complex statistical modelling, but the understanding generated can be very useful in advising patients, and choosing treatments appropriate for their individual circumstances.
Why me?
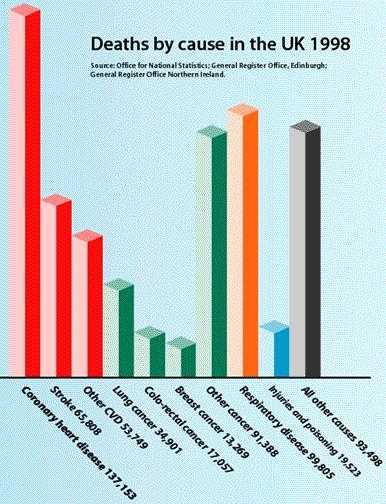
Image used by permission of the British Heart Foundation. Find out more at their website on coronary heart disease statistics
When illness strikes, the natural reaction is to try to come up with some kind of explanation. In one sense it is very often just "bad luck" or what statisticians would see as the random play of chance: however rare the disease, somebody somewhere will get it sometime. But the chances of getting diseases and dying from them vary a lot according to individual characteristics and behaviours, and - as we now begin to understand more clearly - the influence of our genes.
The bar chart shows the number of deaths by different causes in the UK in 1998. The data on cause of death comes from death certificates, which must be filled in by doctors for every person who dies. To find out what you are most likely to die from if you are born and live your life in the UK, you can calculate the probability of dying of heart disease by adding the number of deaths for each
of coronary heart disease, stroke and other CVD, and dividing by the total number of deaths in the UK, to get
Prob (dying from heart disease | UK)= 0.41.
Similarly,
| Prob (dying from cancer| UK) | = | 0.25; |
| Prob (dying from respiratory (breathing) problems | UK) | = | 0.16; |
| Prob (dying from other cause | UK) | = | 0.18. |
We can see straight away that the biggest killer in the UK is heart disease. The British Heart Foundation has a lot of interesting data on heart disease at www.dphpc.ox.ac.uk..
Diagram reprinted by permission of Cancer Research UK
To answer the questions about deaths from cancer, take a look at the graph. (Note that "malignant neoplasms" is just medical jargon for "cancers".) The graph plots the cancer rate for each sex within 10-year age bands for the UK in 1999. For each rate, the numerator comes from death certificates again, this time also making use of the information on age and sex that doctors must record. The denominator for each rate is based on the census that takes place every 10 years, which helps us calculate how many males and females there were in each age band the UK in 1999. Putting this mathematically, the graph tells us
Prob (dying from cancer within 1 year of current age| age, sex, UK).
You can see that males are more likely to die from cancer than females, and that the chances of dying from cancer within a year rises sharply with age in both sexes. More interesting data on cancer can be found on www.cancerresearchuk.org/aboutcancer/.
All the data we have looked at so far comes from death certificates and the census. To refine conditional probabilities further, and to look at illnesses such as asthma, as well as just deaths, researchers use specialist studies, sometimes following up groups of individuals over decades. These require careful planning and analysis using specialised statistical techniques to disentangle the complexity of individual characteristics and behaviours that influence our chances of getting ill and dying from particular causes.
Could it have been prevented?
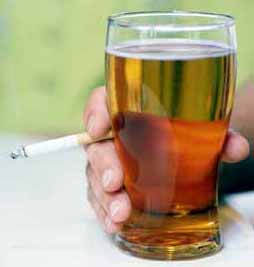
Two possible causes
[Image DHD Photo Gallery]
Part of the motivation for detailed studies of causes of diseases is the possibility of preventing disease. Sometimes the message is obvious. For example, statistics from all sorts of studies across the globe show that
Prob (getting heart disease | smoking, your other characteristics)
is very much greater than
Prob (getting heart disease | not smoking, your other characteristics).
The same relationship holds for lung cancer and deaths from other respiratory diseases. The mathematics clearly reinforces the message "Don't smoke". Other preventive measures may be subtler, and require more specialist studies, but again, the message will be contained in the relevant probabilities.
| Neural Tube Defects | ||||
|---|---|---|---|---|
| Yes | No | Total | ||
| Folic Acid | Yes | 6 | 587 | 593 |
| No | 21 | 581 | 602 | |
| Total | 27 | 1168 | 1195 | |
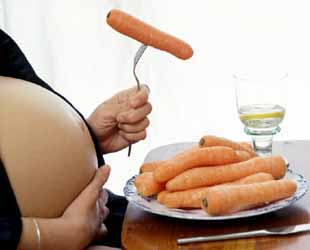
What to eat for the best?
[Image DHD Photo Gallery]
In another important area of study, evidence had pointed towards a link between a mother's diet during pregnancy, and her baby developing neural tube defects (sometimes called spina bifida). One of the possible contributors was thought to be folic acid intake. The question was asked "Can taking folic acid supplements at the time of conception help prevent neural tube defects?". This was tested
using a randomised trial for women at high risk. The full data are shown in the table on the right, and we can estimate
\begin{eqnarray} \mbox{P(neural tube defects | no supplementation)} & = & 0.035;\\ \mbox{P(neural tube defects | supplementation)} & = & 0.010. \end{eqnarray} This represents a reduction in risk of over $70\% =(0.035-0.010) \times 100/0.035.$
These statistics form the basis of the current advice that all women planning a pregnancy should take folic acid supplements.
Preventive medicine presents many other fascinating statistical challenges, for example in the development and evaluation of methods to screen for diseases as diverse as Down's syndrome and ovarian cancer. Before vaccination programmes such as MMR or more recently Meningitis C are offered to the public, data on their benefits and risks have been closely scrutinised by statisticians as well as doctors. Statisticians working in all these areas must be prepared to shoulder a lot of responsibility and be ruthlessly clear and logical in their analyses.
So, next time you are ill, do go and see your doctor. But remember, for a healthier future...statisticians count!
About this article
Deborah Ashby is Professor of Medical Statistics at Queen Mary, University of London. She did degrees in Mathematics and Statistics and has worked in medical statistics for all of her career, at the universities of London and Liverpool. She has worked on the causes of heart disease, cancer and Alzheimer's disease, and for some years has been working on treatment of children and adults with cystic fibrosis. She sits on the Committee of Safety of Medicines, which advises the Minister of Health on which drugs should have a license. Her main role here is to ensure that the manufacturers claims are based on rigorous statistical analysis of the relevant data. She also enjoys trying out new statistical techniques to see if they can help her learn more about some of the fascinating medical studies she is involved in.
Adrian Smith is Principal of Queen Mary, University of London. His first degree was in Mathematics, followed by an MSc and PhD in Statistics. He has worked as an academic statistician at the universities of Oxford, London and Nottingham and acted as statistical consultant to numerous government committees and agencies as well as to the private sector. He is past-President of the Royal Statistical Society and a Fellow of the Royal Society.
If you would like to find out more about careers in medical statistics, take a look at this issue's career interview. For more general information on careers in statistics, you can visit The Royal Statistical Society's career pages.