
Maths in a minute: Graphs and the degree sum formula
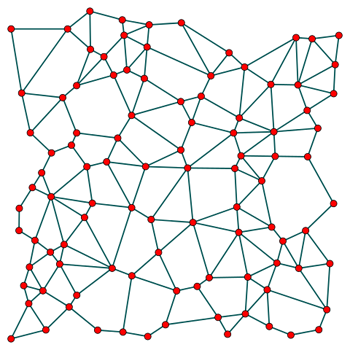
This is an example of a graph.
In maths a graph is what we might normally call a network. It consists of a collection of nodes, called vertices, connected by links, called edges. The degree of a vertex is the number of edges that are attached to it. The degree sum formula says that if you add up the degree of all the vertices in a (finite) graph, the result is twice the number of the edges in the graph.
There's a neat way of proving this result, which involves double counting: you count the same quantity in two different ways that give you two different formulae. Since both formulae count the same thing, you conclude that they must be equal.
The quantity we count is the number of incident pairs (v, e) where v is a vertex and e an edge attached to it. The number of edges connected to a single vertex v is the degree of v. Thus, the sum of all the degrees of vertices in the graph equals the total number of incident pairs (v, e) we wanted to count.
For the second way of counting the incident pairs, notice that each edge is attached to two vertices. Therefore the total number of pairs (v, e) is twice the number of edges. In conclusion, the sum of the degrees equals the total number of incident pairs equals twice the number of edges. Proof complete.
(At this point you might ask what happens if the graph contains loops, that is, edges that start and end at the same vertex. The proof works in this case as well, we leave that for you to figure out.)
You can find out more about graph theory in these Plus articles.