
Were you stuck in traffic on your way to work or school this morning? Then you might take consolation in the thought of yourself as a tiny experimental subject in the giant petri dish of the UK's motorways, contributing your data points to a greater understanding of traffic flow.
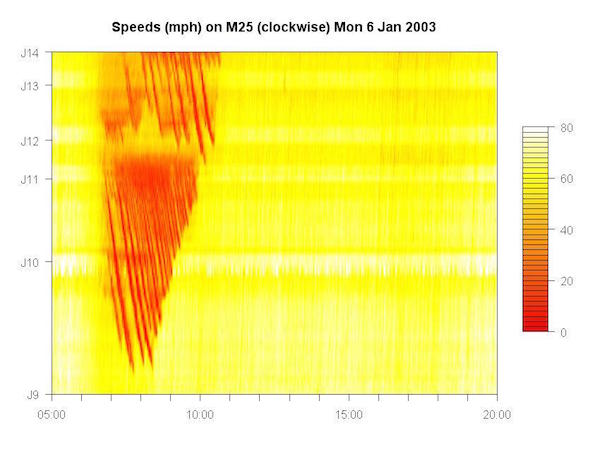
Our image of the week shows a heat map of the traffic on a clockwise section of the M25 (junction 9 to junction 14) showing the speed of cars as a colour, from pale yellow for around 80 mph to red for stationary, as they pass along this stretch of road on a typical Monday. The image was created by Richard Gibbons, from the University of Cambridge's Computer Laboratory. It is based on data collected by the Highways Agency from MIDAS (the Motorway Incident Detection and Automatic Signalling) system, archived minute by minute since 1997 at loop detectors every few hundred metres under many UK motorways.
The diagonal red stripes streaking down the image from the left to right between 7am and 11am are driver's commuting pain manifested in data. A driver's path through the data will start at the bottom and move upwards as they passed along the motorway and to the right as time passed. And if they passed junction 9 at, say, 7.30 in the morning, they would have hit red stripe after red stripe, like striking the incoming wave fronts as you try to swim out from a beach.
These stripes are the wave fronts of a stop and go wave, the infuriating pattern of repeated stopping (red) and starting (yellow) that is well known to both motorists and traffic modellers. This is a kind of shock wave that moves back through the traffic, opposite to the direction the cars are travelling. This can be easily seen in the heat map: one starts around junction 12 and moving backwards down the motorway as time goes on.
Click here to see previous images of the week.