
The reproduction ratio, R, of a disease (often called the R number in the media), is the average number of people an infected person goes on to infect. If R>1, the epidemic of the disease will spread, the larger the R the quicker it will spread. And if R<1 the disease will die out. For seasonal strains of flu, R lies between 0.9 and 2.1, and for measles it is a whopping 12 to 18 for an unvaccinated population.
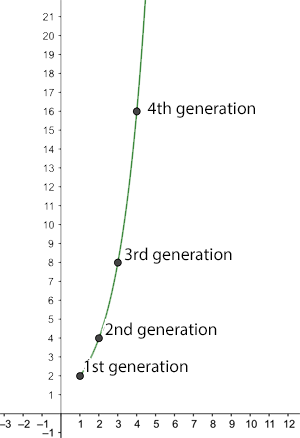
The number of new infections after n generations for R=2.
What if R>1?
You can see how a large enough R leads to a rapid spread of the disease. For example, if R is equal to 2 then a single infected person generates the following growth of new infections:
1st generation: 2 new infections 2nd generation: 4 new infections 3rd generation: 8 new infections 4th generation: 16 new infections...
Assuming a person is only infectious for a day, this means that at total of 31 people (since 31=1+2+4+8+16) will have been infected after just four days. The number of infected people grows very fast, in fact it grows expontentially. At this rate the entire world population (7.8 billion) would be infected after slightly over 32 days! (You can find out why this is at the end of the article!)
What if R<1?
When R is less than 1 a very different picture emerges. As an illustration, imagine we have R=0.5. Now obviously, an infected person can't go on to infect half a person, but remember that this is an average: it means that 10 people can be assumed to go on to infect 5 others, or that 100 people can be assumed to go on to infect 50 others. To make the numbers simpler, let's assume there are 10,000 infected people to start with. Then the number of new infections behaves like this:
1st generation: 5,000 new infections 2nd generation: 2,500 new infections 3rd generation: 1,250 new infections 4th generation: 625 new infections...
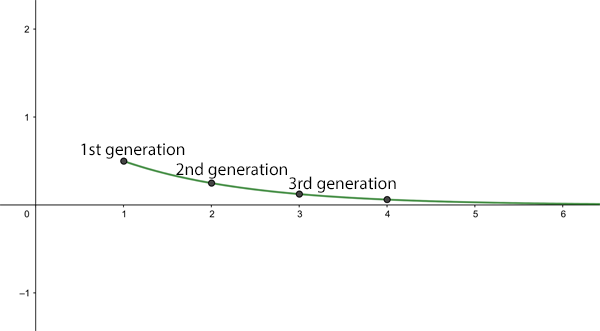
The average number of new infections (in ten thousands) after n generations for R=0.5.
The number of new infections becomes smaller and smaller with each generation until finally noone is infected – resulting in a dead end for the disease.
What if R=1?
What if R=1? In this case the disease will be present in the population, but the number of cases will stay roughly steady over time. When R is 1 we are not dealing with an epidemic.
Can we control R?
So, given that the R of measles, or some strains of seasonal flu, is greater than 1, how come the whole world hasn't been infected with these diseases a long time ago? The reason is that these values of R represent the average number of people an infected person goes on to infect, given that everyone in the population is susceptible. In real life, this might be the case if someone who has become infected with a disease elsewhere enters a part of the world where the disease has never been seen before, so people don't have immunity and there isn't a vaccine to protect them. An R of 2 then means that, at the beginning, the number of infected people will grow wildly, as we've described above.
However, once a person has recovered from the disease they will (hopefully) gain some immunity. This means that after a while we're not dealing with a totally susceptible population anymore. Indeed, there may be other reasons why some people in the population aren't susceptible. And we might be able to take precautionary action to reduce the value of R – such as making a vaccine available or encouraging behavioural interventions (such as social distancing or infected people isolating) that can reduce the chance of people catching or passing on the disease. The current value of R for a disease in a population gives a good indication of how hard it would be to control an epidemic by taking actions to bring the value of R under 1.
To explore this further, let's look at an example. Suppose you have a population that are all susceptible to a disease, which currently has a value of R=4. Then on average, one infected person would infect 4 more.
Now suppose that only a quarter, or 25%, of your population is susceptible to the disease, and three quarters, or 75%, are immune. Then, on average, one infected person would only go on to infect 4 x 1/4 = 1 person. So with only a quarter of your population susceptible you get a value of R=1.
Therefore for a disease that with a value of R=4 for a totally susceptible population, you need more than 75% of your population to be immune to get the effective value of R below 1.
In general, you need the proportion of your population that is immune to a disease to be greater than 1-1/R, in order to get the disease under control by getting the effective value of R below 1.
So to control a disease with a much larger value of R, such as R=18 for measles, you'd need more than 94% of your population to be immune. R gives you a good sense of how much immunity you need in the population to control the disease.
You can find out how the R number is connected to an important concept called herd immunity here.
And finally, if R=2 why would it take only 32 days to infect the whole world?!
At this rate, and assuming a person is only infectious for a day, the total number of people infected after  days is:
![\[ 1+2+2^2+\ldots +2^ n. \]](/MI/a6f6421252fe005a2ff0f6c56d1ba7c1/images/img-0002.png) |
 . Using this we can calculate that after 31 days, over 4 billion people are infected. But one day later, after 32 days, we get over 8 billion, which would mean more people infected that than whole population of the world! If this seems strange to you and you're curious to learn more – click here!
About this article
This article is based on a chapter from the book Understanding numbers by the Plus Editors Rachel Thomas and Marianne Freiberger.
This article is part of our collaboration with JUNIPER, the Joint UNIversities Pandemic and Epidemiological Research network. JUNIPER is a collaborative network of researchers from across the UK who work at the interface between mathematical modelling, infectious disease control and public health policy. You can see more content produced with JUNIPER here.
