
Back to the Do you know what's good for you package
Here is a classroom activity exploring basic epidemiological models. It uses basic probability, and can be used to discuss exponential growth and geometric progressions.
A new and potentially dangerous infectious disease has broken out in the UK. You're an epidemiologist and the government has asked you to forecast how widely the disease will spread.
The authorities have been carefully monitoring those people already infected and their friends and families. Their data show that an infected person typically goes on to infect either one or two others.
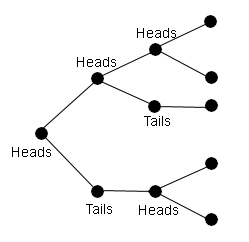
A simulation of the infection using coin tosses.
Step 1: You decide to simulate the spread of the infection using a coin. You assume that there was one infected person to start with. You then flip the coin: if heads comes up, then the infected person goes on to infect one other person, if tails comes up, they go on to infect two other people. You repeat this process for every newly infected person. Do this for at least five "generations" of the infection, keeping track of the new number of infected people at each generation, for example by plotting the number of infected people against the generation of the infection.
For example, the first generation consists of the one infected person you started with. If you get tails in the first round, then two new people are infected, so the second generation contains a total of three infected people, the initial one and two new ones. Flip the coin again for each of the new people. If you get one heads and one tails, then three new people are infected, so the third generation contains a total of six infected people, and so on.
How many infected people do you have at the end? Repeat the simulation several times. In general, do you think that the infection will go on spreading, or will it die out of its own accord?
Step 2: The government is thinking about introducing measures to reduce the rate at which infected people go on to infect others, for example, by putting infected people into quarantine, or giving them anti-viral drugs which reduce the length of time they're ill.
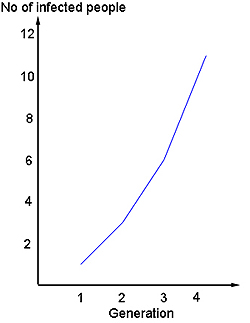
The number of infected people in each generation of the infection.
To find out what effect such measures might have, you decide to see what happens to your simulation if the number of people an infectious person infects is reduced by one in each case. So if heads comes up, the person goes on to infect nobody at all, and if tails comes up they go on to infect only one person. What is the likely course of the infection now?
Step 3: In Step 1 some people went on to infect one other person and others went on to infect two other people. There was a fifty-fifty chance that either occurs. So, on average, how many people does an infectious person infect? How many people does an infectious person infect on average in Step 2? Do these averages tell you anything about the likely course of the infection?
Step 4: Epidemiologists call the average number an infected person infects (assuming that no one in the population is immune to the disease) the basic reproduction ratio of the disease. It holds information about how fast a disease is likely to spread. The basic reproduction ratio of swine flu is around 1.5, for measles it's around 12. What are the basic reproduction ratios for each of the simulations in Steps 1 and 2?
Step 5: Epidemiologists say that an infection will eventually die out if the basic reproduction ratio is less than 1, and keep on spreading if it is greater than 1. Can you see why? In the light of this, what should any intervention, like putting people into quarantine, giving them anti-viral drugs, or vaccinating them, aim to do?
Step 6 (harder): Scientists have developed a vaccine for the infectious disease, and the authorities have asked you what proportion of the population should be vaccinated to make sure that the infection eventually dies out. Referring to your books, you see that a proportion of at least 1-1/R should be vaccinated, where R is the basic reproduction ratio of the disease. Taking the R of the simulation in Step 1, what proportion should at least be vaccinated according to this rule? Can you see why this would ensure that the infection eventually dies out?
Step 7: The simulations in Steps 1 and 2 are simple models of the spread of the infection. Are they realistic? How could you improve them?
Here is some guidance for this activity.
Also, you can explore a more sophisticated model of an epidemic using the interactive animation on our sister site NRICH, which is based on the Build your own epidemic project work on our sister site Motivate.
Back to the Mathematics of infectious disease package