
Most of us have a vague idea of how you might go about predicting the result of this week's general election: go out and ask a large and random collection of people who they intend to vote for. The share of the vote each party gets in your sample of people reflects the share of the vote you can expect nationally.
That's nice and simple, but there are many weird and wonderful ways it can go wrong. In this election we may well be dealing with a "shy UKIP" effect: people not wanting to admit they like UKIP, in case they appear stupid and racist, but then going and voting for them anyway (a shy Tory phenomenon has been observed in the past). Bias can also creep in through the way people are being picked for a survey, for example by choosing houses with shorter drive ways, which may lead you to choosing too many people that are naturally left-leaning. That's also happened before. And although it's unlikely to be the case in this election, people have in the past shown a tendency to forget about the smaller parties when asked about their voting behaviour. All this is on top of the uncertainty that naturally creeps in when you try to predict a future event from a sample that's not the whole population.
And there's another problem too. The election isn't decided on the national share of the vote, but on the number of seats, that is, on who wins the majority of votes in each constituency. So you'd really have to go and poll a large number of people in each constituency — and that's a lot of polls to conduct.
This is why election forecasting is a very sophisticated business. The forecaster ElectionForecastUK, for example, uses data from YouGov and all publicly released national and constituency polls. They combine this with historical election results going back to 1979, as well as data from the UK Census.
The general approach (nicely explained on their website) is this. Start by pooling all the different polls people have been conducting. This might seem easy: simply take an average of the outcomes over all the different polls. The problem is, however, that different polls are known to come with different biases, arising from the way they collect their data (think of the drive ways), the sample size of the polls, and the time intervals at which they are taken. So even pooling these poll results takes considerable sophistication — academic research papers have been written about it.
How will the country vote?
The results from the pooled polls now gives you an idea of what the share of the vote for each party might be nationally (though you still need to adjust for biases that you know exist from experience). But as we've seen, that's not really good enough. You need an idea of what will happen in individual constituencies. One thing to do is look at how a constituency deviated from the national result in the past, and that's what forecasters have done traditionally. You also have the information from the current polls, of course, but those polls may have included too few people from your constituency to give an accurate reflection of voting intentions there.
So ElectionForecastUK use what they know about each constituency to squeeze as much mileage out of their information as possible. The particular characteristics of a constituency — the party that's currently in power, geographical location, population density, average age, religious affiliations and so on — obviously give you some idea of how that constituency is going to vote. If you can understand that relationship between the constituency's characteristics and an individual's voting intentions, then you can estimate how strong the two are correlated. And if that correlation is strong enough, then you can make reasonably confident estimates of who's going to win the corresponding seat, even if your polling data is limited. Once you have an idea of what might happen in individual constituencies, you can hazard a guess as to the overall election result.
This is the general idea, but behind it lie sophisticated statistical models. The basic statistics you might learn about at school is all about proportions (or frequencies as they are technically called). If out of 100 people 25 say they will vote Labour, then your estimate of the probability that a randomly chosen person will vote Labour is 0.25. But for the frequency approach to work, you need raw data — information that comes from numbers, which you simply may not have. "Particularly in this election things are very different from previous elections," says David Spiegelhalter, a statistician at the University of Cambridge. "For example there's almost no historical data on the effect of UKIP. So there has to be an element of judgment."
Luckily, there is a branch of statistics, called Bayesian analysis, which allows you to deal with this problem. "Bayesian analysis gives you a formal way of introducing subjective judgment, uncertain judgment, into a statistical model," says Spiegelhalter. "It is used to express 'epistemic' uncertainty about the unobservable parameters underlying the system — for example our uncertainty about the silent tory effect. It is also used to allow the results in a particular constituency to be correlated with other similar constituencies, essentially saying they are similar: not identical, not completely independent." The aim is to produce a probability of each candidate winning in each constituency. To work out the probability of a party winning the overall election, you add up the probabilities of it winning the individual seats.
A Bayesian model doesn't give you a neat mathematical formula that tells you how a probability depends on other parameters like, say, polling results. What you can do, however, is use its results to simulate lots of elections (using a process called Markov chain Monte Carlo). It's a bit like playing a computer game in which you send a virtual population to the polls thousands of times or more. The outcome of the election will be different each time because the virtual people's behaviour is governed by probabilities, not certainties. This then gives you a distribution of outcomes, as shown in the picture. From this you can then compute your prediction: the more often a particular outcome appears in your simulation, the more likely you deem it to be in reality.
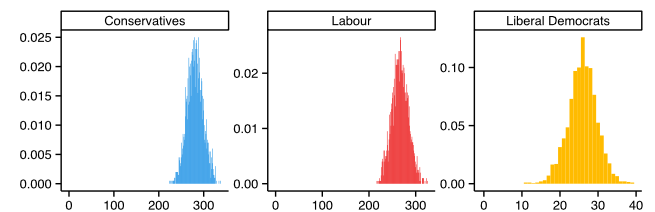
The horizontal axis of these histograms gives the number of seats and the vertical axis the proportion of simulated elections in which the corresponding party got that number of seats. Taken from ElectionForecastUK on May 5th 2015.
A crucial component of statistical modelling is to keep track of your uncertainties — for example those introduced through your subjective judgment. There are ways of quantifying those uncertainties and keeping track of what happens to them in your analysis. The final result, therefore, is never a certain prediction, but only a probability. This is reflected in the forecast of ElectionForecastUk. Today (May 5th, 2015) the prediction is:
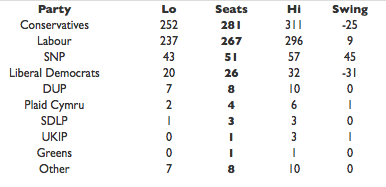
Taken from ElectionForecastUK on May 5th 2015.
Notice the "Lo" and "Hi" values. This means that, according to the method used, there is a 90% chance that the number of seats gained by a party lies in between the Lo and Hi value in the corresponding row. The number in the "Seats" column is the mean number of seats over all the simulations.
Bayesian analysis is being used in all sorts of areas, not just election forecasting. Spiegelhalter has developed a computer language called BUGS, designed to be used in the biomedical sciences. An alternative incarnation of BUGS, called JAGS, is being used in election forecasting. Very similar models to the ones used to predict life expectancy in local areas, for example, are also being used to predict voting behaviour in constituencies. "We developed BUGS for biomedical applications, but then we found that people are using it in all sorts of areas. That's because it can handle those very complex problems which you can't put into any other software."
What makes election forecasting very different from many other other applications is that we'll soon find out, unequivocally, whether its predictions are correct: this will probably be some time in the early hours of May 8th.