
Alan Turing is considered to be one of the most brilliant mathematicians of the last century. He helped crack the German Enigma code during the Second World War and laid the foundations for the digital computer. His only foray into mathematical biology produced a paper so insightful that it is still regularly cited today, over 50 years since it was published.
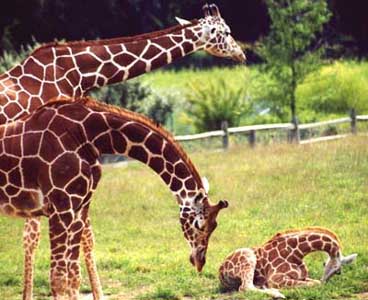 Reticulated giraffe |
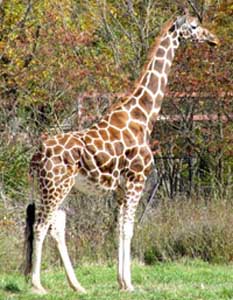 Rothschild's giraffe |
Modelling an embryo
Turing's paper described how "reaction-diffusion equations" might be used by animals to generate patterned structure during their development as an embryo. Animals start as a single cell that divides many times to create a full-size individual. During the early stages, the small ball of cells is completely uniform, or homogeneous, but out of this develop the dramatic patterns of a zebra, leopard, giraffe, butterfly or angelfish. Turing was interested in how a spatially homogeneous system, such as a uniform ball of cells, can generate a spatially inhomogeneous but static pattern, such as the stripes of a zebra. He managed to formulate a series of differential equations that, when solved, show very elegantly how the diversity of wonderful patterns on animals might be created.
Imagine an embryo with two types of chemical inside it. The two chemicals, as we will see, interact to generate patterns, and so are called morphogens (morpho from the Greek for "form", and gen from the Greek for "to beget"). For the sake of this discussion, we can imagine the embryo as a one-dimensional line and look at the concentration of each of the two morphogens at each point along the line. The chemicals can diffuse left and right along the line from a point of high concentration to lower concentration, and can also be produced afresh by cells along the embryo. One morphogen is an "Inhibitor" and suppresses the production of both itself and the other chemical. The other, an "Activator", promotes the production of both morphogens.
At any time (t) and any point along the embryo (x), the concentrations of the Activator and Inhibitor are given by A(x,t) and I(x,t) respectively. But these concentrations change over time due to new production (a reaction) and diffusion. The system is therefore known as a reaction-diffusion equation.
As we saw in Making the grade in Issue 27 of Plus, differentiation is a method of working out the gradient of a curve - how quickly one variable changes with respect to another. If, as in this case, the function is of two variables (x and t) then calculating the gradient with respect to just one of them is known as partial differentiation.
So the change of concentration of Activator over time can be written as the partial differential equationThe extra term, d, on the right-hand side is the diffusion coefficient - how much quicker Inhibitor diffuses than Activator. The Inhibitor being a faster diffuser was shown by Turing to be pivotal in driving the process of pattern generation.
Very perturbing
Initially (i.e. when t=0), the two chemicals are in equilibrium -their concentrations do not change over time. The amount of Activator and Inhibitor is just right so that the reaction and diffusion rates exactly balance. The situation is an "unstable equilibrium", however, and the first nudge, or perturbation in maths speak, knocks the system away from this equilibrium. It is like a pencil poised on its tip - it might be perfectly balanced but the slightest nudge pushes the pencil over and it never recovers this equilibrium point.
Say that, for whatever reason, the concentration of Activator increases slightly at one point. Now the local concentration of Activator is greater than Inhibitor, so more Activator is produced, and so on in a snowball effect. But Inhibitor is also being produced, and because it diffuses faster it quickly spreads to either side of the perturbation and decreases the concentration of Activator there. So you end up with a region of high Activator concentration bordered on both sides by high Inhibitor.
This process can be seen in the video to the right. As the animation steps through time the concentration of Activator along the embryo organises into a series of peaks.
The reaction-diffusion equations can also be formulated for two dimensions. In this case an island of high Activator becomes surrounded by a moat of Inhibitor. Beyond this inhibitory halo, however, the levels of Inhibitor drop again and so other seeds can produce an area of high activator concentration. In this way the symmetry of the uniform concentration is broken into roughly evenly spaced regions of high Activator.
Revealing the pattern
An activator landscape
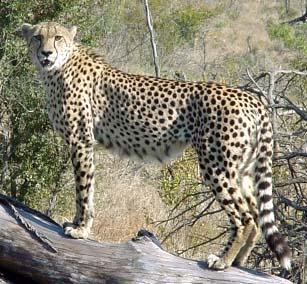
The Activator and Inhibitor are not colour pigments themselves, just the morphogens that interact to create an underlying pattern. If the Activator also promotes the generation of a pigment in the skin of the animal then this pattern can be made visible. Skin cells could produce yellow pigment unless they detect high levels of Activator instructing them to produce black. This would yield a visible pattern similar to that of a cheetah.
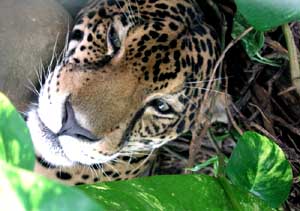
The size of these spots will depend on what are known as thresholds. The concentration of Activator can be thought of as a landscape of hills, with a certain concentration of Activator (i.e. altitude) required to turn ON the pigment. If this threshold is high, then only tiny spots at the very summit of the hills are seen, but if the threshold is lowered, then more of each hill is coloured and the spots are larger with less space between them. Such a mechanism may explain the difference in markings between two subspecies of giraffe: the Rothschild's giraffe and the reticulated giraffe (shown at the top of this page), the first of which has smaller, more widely-spaced spots than the other.
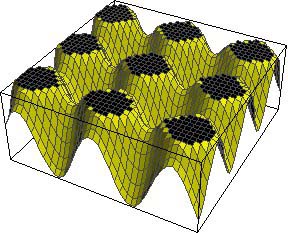 A low threshold for turning pigment ON |
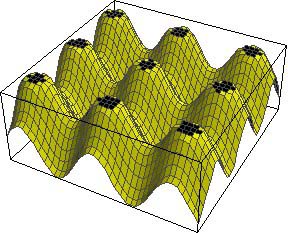 A high threshold for turning pigment ON |
Saturation can also be an important factor. If the concentration of Activator can reach a maximum value (ie. it is produced as fast as it breaks down or diffuses away) then the spots may join up into stripes. This is believed to be what happens in the zebra.
Size matters
The size of the embryo at the time of pattern generation is also very important. If the Inhibitor diffuses quickly relative to the size of the domain then few spots will be able to form. In fact, the stationary wave of Activator concentration is very similar to modes of vibration on a guitar string: only certain wavelengths can fit. The diagram below shows the reaction-diffusion simulation run on "embryos" of different sizes: 5, 30, 150 and 1000 units long. No pattern at all can form on small animals, and on very large animals the spots are too small-scale and seem to blend together.
The cheetah has spots on its body and a stripy tail - but it's not possible for a stripy animal to have a spotted tail
Some developmental biologists have argued that this explains why neither small mice nor large elephants have any patterning. In between, however, more and more spots fit along the embryo. If d (the diffusion constant) is assumed to be the same for all mammals, then this would explain why hamsters have only a few patches of colour whilst leopards have hundreds of small spots.
The size of the domain also affects the type of patterns that can form. An animal's tail can be thought of as a cylinder with a steadily decreasing radius. The top is large enough to support two-dimensional patterns like spots, but down at the bottom the domain becomes too small. The region of high Activator spreads all the way around the tail and joins up with itself, so that a spot becomes a stripe. The transition between spots and stripes is shown very well by a cheetah's tail. This aspect of the maths also explains why a spotted animal can have a striped tail, but a striped animal can never have a spotted tail.
The process of pattern generation is completed in mammals during the embryonic stage. But some animals need to keep their markings up to date as they grow to full size. The stripes along the Marine angelfish move very slowly over time as the domain size increases. The basic bands on a young fish move apart as the fish grows, with new stripes appearing or dividing off existing ones to fill in any gaps.
Nature as Art?
The perturbations that trigger spots and stripes are usually statistical variations in the rate of morphogen production or diffusion. But physical disturbances from outside the embryo can have the same effect. The beautiful eyespots on butterfly wings are thought to rely on the principles described above, although involving more morphogens. Marta de Menezes produces art with living objects by pricking a butterfly wing with a pin while it is still developing in the chrysalis. This disrupts the concentration gradients and so alters the natural design.
Further reading
- A. Turing (1952). The Chemical Basis of Morphogenesis. Philosophical Transactions of the Royal Society of London. Available for free download, at participating institutions, from JSTOR.
- J.D. Murray (2001). Mathematical Biology. Published by Springer-Verlag New York Inc.
- D.S. Jones and B.D. Sleeman (2003). Differential Equations and Mathematical Biology. Published by Chapman & Hall.
About this article

Lewis Dartnell read Biological Sciences at Queen's College, Oxford. He took a year off to travel, but has now started a four-year MRes/PhD program in Bioinformatics at University College London's Centre for multidisciplinary science, CoMPLEX. In 2003 he came second in the THES/OUP science writing competition with an article on the parallels between language and the structure of proteins.
Comments
Reaction Diffusion
Hi,
Thanks for the article. You may be interested in a project I've been tinkering with over the last few months - an online reaction diffusion laboratory. It simulates a few well known reaction diffusion systems and recreates phenomina such as solitons, tip splitting and different waves.
It's an ongoing project and the blog link is: http://flexmonkey.blogspot.co.uk/search/label/ReDiLab
Cheers,
Simon
Leopard Print
How can a fish (leopard gourami) have the exact same coat as a leopard? i cannot comprehend this.