
On March 17, 1914 a woman known only as Mrs X suffered a cook's worst nightmare. She had prepared a dish of baked spaghetti for a large church dinner in Hanford, California. Unwittingly, she had added an unwanted ingredient to the dish: bacteria of typhoid fever. Mrs X had caught the disease several years earlier when it broke out in a boarding house she ran, but never developed any symptoms. The diners were not so lucky though. Ninety-three people who ate Mrs X's spaghetti fell sick with typhoid, and three of these sadly died.

Hungry?
While it spooked the population of Hanford, the case also raised two questions in the minds of scientists. The first was how the typhoid bacillus could have survived being baked in the oven. The second was why the time it took for the 93 people to develop symptoms varied so drastically. Some fell sick within three days, others not until over three weeks later. Two victims had the time to travel over 200 miles to San Francisco and got sick there, a fact that could have, but luckily didn't, spark a major epidemic in a big city.
To this day biologists don't know why the incubation period of typhoid is so variable. They do know, however, that typhoid isn't the only infectious disease that shows up this variability: measles, malaria, polio, chicken pox and the common cold do as well.
What is more, if for a particular outbreak you count how many people got sick on the first day after coming in contact with the disease, how many people got sick on the second day, the third day, and so on, the patterns you get are very similar for all the diseases mentioned above (see the plots below). There is a single peak relatively soon after a person comes in contact with the disease — that's when most people get sick — and then the number of cases drops off rather slowly, indicating that a small but significant number of people don't develop symptoms until quite a long time later. For all these diseases the dispersion factor, a number which measures the variability, lies between 1.1 and 1.5.
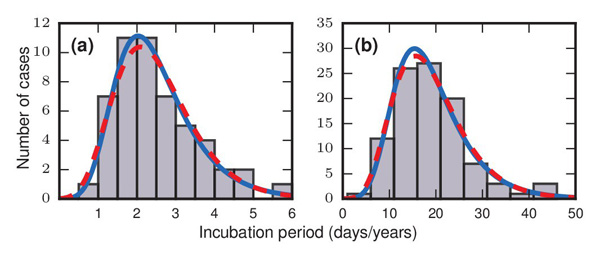
The grey bars in these two figures show how many people developed symptoms a given number of days/years after they came in contact with a disease. Figure a) represents an outbreak of food-borne streptococcal sore throat, reported in 1950. Time is measured in units of days in this case. Figure b) represents a 1949 study of bladder tumours among workers following exposure to a carcinogen in a dye plant. Time here is measured in years. The dashed red and solid blue curves are probability distributions that match the pattern of the bars very well, indicating that the incubation periods might follow these distributions. The work of Strogatz and colleagues suggests that incubation periods follow Gumbel distributions, represented here by the solid blue curves. Image reproduced from the paper Evolutionary dynamics of incubation periods, reproduced under a Creative Commons Licence.
One possible explanation for the variability is that every case is different. The people at the Hanford church dinner would have eaten varying amounts of spaghetti contaminated with varying doses of typhoid, and their bodies would have dealt with the bacillus each in its own way. Experiments with polio, however, have shown that the variability can still occur when all factors are kept equal. Could there be some other mechanism at play that produces the variable incubation times?
When biology fails mathematics can sometimes help. In a recent study the mathematician Steven Strogatz (author of one of our favourite popular maths books) and colleagues devised a toy model of how a disease might infect someone's body, and found that the dynamics of this model can produce just the variability observed in reality. Their work suggests that incubation periods can vary so much for a reason that also explains why it takes so long to collect a full set of, say, football cards that come with a chocolate bar to entice you to buy it. It's down to probabilities and chance.
Strogatz, Bertrand Ottino-Löffler and Jacob G. Scott based their model on the idea that an infection plays out as a battle between invading agents — bacteria or cells — and harmless resident agents that live in a person's body. This set-up works in a range of situations, from typhoid bacteria battling against harmless bacteria in someone's gut, to leukemia cells competing with healthy cells in a person's bone marrow. The model has agents arranged in a network: each agent is linked up to one or more nearest neighbours, which it can influence. Agents can also reproduce. If, over time, the invading agents manage to take over the whole network, then the person hosting the battle is considered to have become infected with the disease.
The rules that determine the reproduction and interaction between
agents are relatively simple. Agents come with a number  measuring
their fighting power, or fitness. Healthy resident agents
have a fitness of 1, but the fitness of invading disease agents can
take any value.
measuring
their fighting power, or fitness. Healthy resident agents
have a fitness of 1, but the fitness of invading disease agents can
take any value.
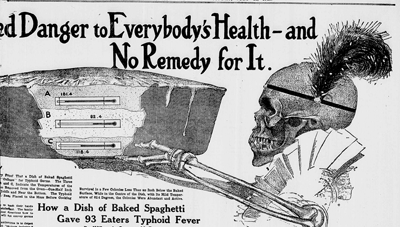
Headline and illustration of an article about the Hanford outbreak published in the Richmond Times-Dispatch on July 11, 1915.
The incubation process starts with a network containing only a single invading agent with all other agents being healthy residents. One agent is then chosen at random out of the pool of residents and invader, with a probability that's proportional to its fitness: the higher the fitness, the greater the chance that an agent is chosen. The chosen agent then produces an offspring with the same fitness as itself. This offspring will kill and replace one of the chosen agent's neighbours in the network. The doomed neighbour will be picked at random from all of the chosen agent's neighbours, with each neighbour having the same probability of being picked. The process is then repeated: an agent is again chosen at random, reproduces, and replaces a neighbour with its offspring. The incubation period of the disease is the number of times the process needs to be repeated until the diseased invaders have taken over the entire network, if that ever occurs. (The researchers also produced another model, but it's very similar to this one and we won't consider it here.)
Strogatz and colleagues found interesting results when they set the fitness  of the invaders equal to infinity. That’s a dramatic choice, but the researchers say it serves as a reasonable approximation for very aggressive cancer cells or viral infections. The infinite difference between the fitness of invaders and the fitness of residents (which is equal to 1) means that invaders are picked with probability 1 and healthy residents with probability 0. In other words, only invaders will be picked to reproduce and replace a neighbour, so they will eventually take over the whole network.
The invaders are hampered, however, by a probabilistic fact. When an invader chooses a neighbouring agent to replace with its offspring it does so blindly: each neighbouring agent has the same chance of being killed, be they invaders or not. Invaders could obviously take over the entire network much quicker if they only chose to replace healthy residents rather than agents of their own kind. The time-wasting self-replacements slow down the incubation process and also produce a lot of variability.
When the network of agents is very linked-up, so that every agent is connected to most or all other agents, we find ourselves in the football card situation. Invaders now have the chance to replace any, or almost any, other agent in the network, because all, or almost all, other agents are their neighbours.
In the beginning, when most agents are healthy residents, this means that mostly healthy residents are picked for replacement by invaders, so the number of invaders grows fast. After a while though, an invader that has been chosen to produce offspring will have mostly other invaders as neighbours, so the chance of picking a healthy resident neighbour for the kill is small. Picking out the last few remaining residents can therefore take a long time, just as collecting those last few football cards takes a long time: the chance of getting a new card decreases as the number of different cards you already have grows. (See here for the maths of collecting football cards.) These potentially long waits for the last healthy agents to be replaced draws out the incubation period in sufficiently many cases to produce a variability pattern as seen in the plots above.
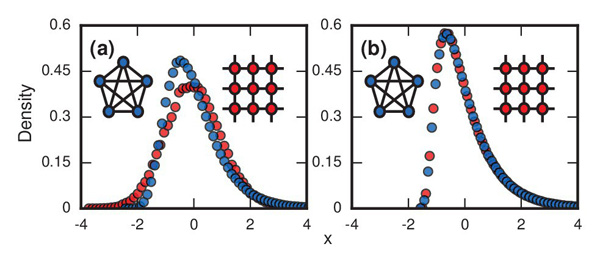
The plots show the distributions of incubation periods that were simulated on a computer using the model described in this article. Figure a) has r set equal to infinity and shows results of the model run on a complete network in which every node is linked to every other node (blue circles) and on a 2D lattice (red circles). The resulting curve for the complete network is longer on the right than on the left: it reflects the football-card-collection situation. Figure b) has r=1 and again involves a complete network and a lattice. The skew to the right appears in both cases. Image reproduced from the paper Evolutionary dynamics of incubation periods, reproduced under a Creative Commons Licence.
Strogatz and his colleagues came by their results by working
through the mathematics that describes the dynamics of the model, and
by simulating the process of reproduction and replacement on a
computer for different types of networks and different values of the fitness . Many other values of also produced incubation patterns
like the ones seen in reality, though not necessarily for the
football-card-collection reason. Rather pleasingly, when the value
of is large, the model produced dispersion
factors between 1.1 and 1.4, very close to the range observed in
reality. This suggests that the researchers may be onto something. "We predict that two equally healthy individuals subjected to equal doses of equally pathogenic agents may, by chance alone, show remarkably different time courses of disease," the say in their paper.
Returning to the Hanford dinner, what about the first question asked by scientists: how the typhoid bacillus could have survived being baked in the oven? To clear it up, scientists of the day carefully prepared the dish of spaghetti in the lab, using the exact same method and recipe that Mrs X had used, and not forgetting to infect the dish with typhoid. The experiment showed that the cooking time and temperature weren't nearly enough to sterilise the whole dish, particularly not in the middle. The sauce used in the dish, made mostly of milk, seems to have been the main culprit in allowing the bacillus to multiply. You can find out more in this newspaper article from 1915.