The formula that plots (almost) everything
Hold onto your logic hats! In this article we're going to explore one of the most amazing formulas in maths: Tupper's self-referential formula.
Meet the monster
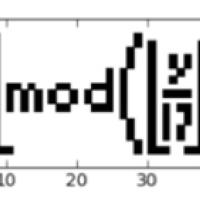
The protagonist of our story is the following inequality \begin{equation}\frac{1}{2} < \Bigl\lfloor mod\left(\Bigl\lfloor\frac{y}{17}\Bigr\rfloor 2^{-17\lfloor x \rfloor - mod(\lfloor y \rfloor, 17)},2\right)\Bigr\rfloor.\end{equation}Looks frightening, but we can unravel it. The symbols $\lfloor$ and $\rfloor$ together denote the floor function: for a real number $a$, the floor $\lfloor a \rfloor$ of $a$ is the largest integer that's no bigger than $a$. For example, $\lfloor 3.5 \rfloor = 3.$ The function $mod(a,b)$ computes the remainder you get when you divide $a$ by $b$, for example $mod(8,3) = 2.$ Given two integers $x$ and $y$ you can work out the right hand side of expression (1) and then see if the inequality is satisfied. (See here for an example.)
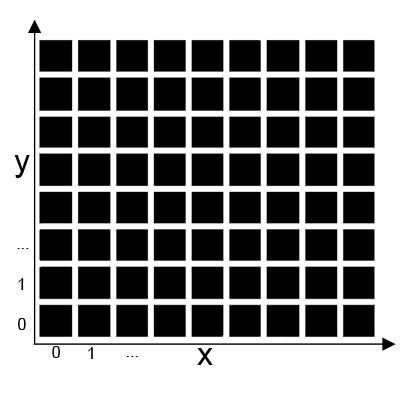
The Dr. Frankenstein behind this creature is computer scientist Jeff Tupper. In a 2001 paper Tupper introduced this expression merely as an example; it was just one function that could be plotted with graphing software. To create a plot from the formula imagine portioning the (x,y)-plane into squares of side length 1 as shown below:
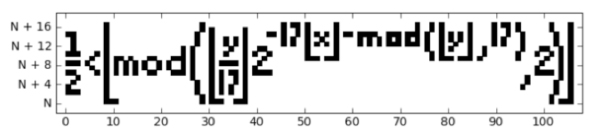
I'll let that sink in a moment. No, your eyes are not deceiving you, the formula plots a bitmap picture of itself! Hence the name Tupper's self-referential formula (though Tupper never called this function that himself in his 2001 paper).
There is one missing detail, however. I haven't told you the value of the number $N$ on the $y$-axis. It's the following very large number:N=
48584506367553158331443764950773878754347780470048007907705681868268549133874
09480464319898086711955985226348628612592051572519203470384822977841686502813
77234155007166522269961098691358424796883658706253737085596435821784280478722
13696947681398349728257073340129737704695046084444680784901911089876226910416
18529314068404487537214619861255268382593637759805767813182770282392391246557
25990212360746666521455598337649788424029641285059433707448118505714209060357
59846215086373488040681121290870152250539945125376670435732830904138081401053
25068.
[Note: This might disagree with values you find in other articles on Tupper's formula. This is because there are two conventions for how to display the coordinate system. In mathematics the positive y-axis runs upwards while in computer science it is sometime taken to run downwards. But whatever convention you use with what number, the worst that can happen is that the plot appears up side down.]
If you look at the squares with $y$-coordinates between $N$ and $N+16$ (and ignore all squares with $y$-coordinates less than $N$ and greater than $N+16$, you will see the bitmap image of Tupper's formula itself.The Plot Thickens
Now let’s take it up a notch. Say we didn't like our 543-digit value of $N$ and wanted to scroll up and down the $y$-axis and see what plots we get then. As you scroll up and down the $y$-axis from minus infinity (indicated by the downwards direction) to plus infinity (indicated by the upward direction) Tupper's formula plots almost everything. Any picture that can be represented by a grid of pixels of dimensions 106x17 using two colours is somewhere in the plot of the formula for a particular values of $N$. Here are some examples.
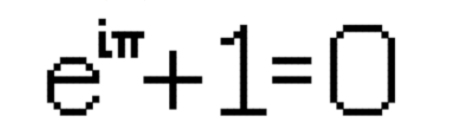
This is Euler's identity, one of the most famous equations in mathematics and often deemed the most beautiful:
N=
235203593994965812214082964919796092930697481362502826329293478195407359549554
461414064845734246156488732522345562080420479601143495511102237660163585321047
66333189919904621926879991093082094723154197136522381859675187313545969846766
98288025582563654632501009155760415054499960.
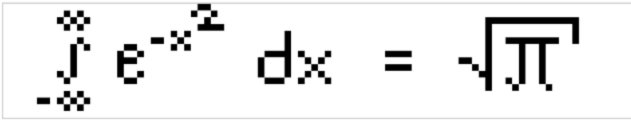
Next there is a picture of the Gaussian integral, another favourite expression in maths:
N=
50841181472523779349018468560792805171297870906911396321947232235596188920550
96478752431824874245480110653021954952550766775791954283419746482575912269436
24088561851582362286514668228623643268365545205530024977530231620346490475113
42452117772179231741688390738222542812441617176773173043283310091922216589623
43464225242834589536554831659267451061125242410083064067401671242198954341161
42045940981532296849259570821460383355145202351587983360.
Obviously, we don't need to restrict ourselves to pictures of mathematical expressions. Any 106x17 grid of pixels can be found somewhere in the plot of Tupper's formula.
From picture to N
As previously explained, the plotting of this bitmap function transpires over a series of squares. Say you had a picture in mind you wanted to graph and needed to know the corresponding N-value — how would you find it? The process is rather simple:
- Beginning in the bottom left pixel of your desired image, write down a 1 if the pixel is coloured in or a 0 if it is blank. Now consider the square directly above and write down either a 1 or 0 in the same way.
- Continue to move up the first column. Once the first column is dealt with, move onto the second column beginning with the bottom square in this second column. Repeat the allocation of 0s and 1s as above.
- Move up the second column, then the third, fourth, fifth and so on until you have assigned a 0 or 1 to each pixel in each column of the 106x17 pixel image.
- You will now have an incredibly long string of 0s and 1s (a 1802 digit string to be exact). This string represents a binary number. Convert this number into base 10 and multiply by 17.
- Like magic , you now have the value of $N$ that corresponds to the image you want to plot.
If you would like to play with Tupper's formula yourself, then visit this website. You can email your creations to us, together with the corresponding value of N, and we'll publish the best ones!
You might also want to watch the Numberphile video below.
Enjoy!
About the author

Harmeet Singh is an A-Level student from London. His A-Levels include Maths, both Further and Advanced, alongside English Literature. He is incredibly passionate about pure mathematics, particularly the Riemann Hypothesis and analysis. Harmeet hopes to complete a mathematics degree at Trinity College, Cambridge, leading onto a professorship and FRS, akin to his idols Ramanujan and G.H. Hardy.
Comments
Andrew1
Nice article - thanks. I'm going to have a play on the linked website!
Harmeet Singh
Thank you very much and enjoy!
- Harmeet (the author)
Parishkrat
Kindly suggest me any app to plot this graph!!
Chuck Mire, artmaker43@gmail.com
The value for N does not work when entered into elmismopancho's Tupper Plotter at:
https://elmismopancho.cl/demos/github/everythingformula/index.html
The other plots such as Gaussian integral are correct and work.
Can you double check the value for N?
Thanks
Rachel
Thank you for letting us know, a few digits were reversed - it's fixed now!
Oli
Great stuff - thanks for that!
Harmeet
Thank you very much!
- Harmeet
Jose Maria Carrero
Thank you for the article! I have enjoyed it
An equivalent way to figure out the value of N is to see the 1802 squares as if they were the elements
of a geometric progression whose first member is a(1)=17 (the square on the botton of the first column) and ratio=2.
The element on the top of the first column would be a(17) and the element on the botton of the second column would be a(18), and so on.
If, for example, we wanted to plot the third square from the botton of the second column the value of N would be:
N = a(20) = 17 x 2^(20-1) = 17 x 2^19 = 8912896
And if we also wanted to plot the top square of the fourth column:
N = a(20) + a(68) = 17 x 2^(20-1) + 17 x 2^(68-1) = 8912896 + 2508757194024499019776 = 2508757194024507932672
In other words, according to its position inside the geometric progression, each square has a value that has to be added to the value of other squares to be plotted together.
The final result for N is the same, but seen from other perspective. :-)
Harmeet Singh
Thank you very much and that's a really interesting perspective on the value of N. Fascinating!
- Harmeet