Citizen science: Schumann resonances
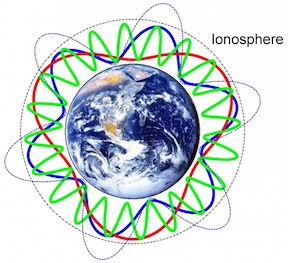
Electromagnetic waves created by lightning flashes and trapped between the ground and the ionosphere – here shown in blue, green, and red – circle around Earth, creating Schumann resonance. (Image Credit: NASA/Simoes)
Summer thunderstorms have just rolled across Europe, some of the 2,000 or so around the globe at any time. The lightning flashes from these storms, about 50 every second, generate electromagnetic energy that begins to circle the Earth as a wave, trapped between the ground and the ionosphere.
The ionosphere is the region of the Earth's atmosphere that starts at around 50-100km above the surface (depending on day or night), and reaches upward for several hundreds of kilometres. Due to solar radiation, individual electrons are dislodged from otherwise neutral gas atoms in this region, creating positively charged ions. This makes the ionosphere conductive, and able to trap electromagnetic waves.
The electromagnetic wave generated by a lightning flash goes around the Earth, bouncing back and forth between the Earth's surface and the lower boundary of the ionosphere. If its wavelength is a multiple of the Earth's circumference, the wave hits itself again at the right spot so that the highs and lows of the overlapping wave are aligned, creating a resonant wave that amplifies itself. In principle electromagnetic waves of any frequency are generated by the lightning, but only those waves with the right frequencies will get amplified and form resonant waves.
Schumannn resonances
The existence of such resonant electromagnetic waves was predicted mathematically in 1952 by W. O. Schumann, a German physicist. Schumann was interested in the frequencies of the resonant waves, that is, how many times they oscillate per second (measured in hertz, where 1Hz is one oscillation per second). To calculate the $n^{th}$ resonant frequency mode ($f_n$), you need to know the distance the wave has to repeat over (the circumference of the Earth, which is $2 \pi r$, where $r$ is the radius of the Earth, about 6,371km on average) and the speed of the wave (which is the speed of light $c$, roughly 300,000km/s, as it is an electromagnetic wave). Then $$ f_n = \frac{c}{2 \pi r} \sqrt{n(n+1)}. $$ Plugging the given values of $r$ and $c$ for $n=$1 (the base frequency, which has the highest intensity) into the formula above gives: $$ f_1 = \frac{300,000\mbox{km/s}}{2 \pi \times 6,371\mbox{km}}\sqrt{2} = 10.6\mbox{Hz}. $$ Indeed, this is similar to Schumann's original calculation of $\approx$11Hz for the base frequency. Higher order resonance frequencies (with decreasing intensities) can be calculated similarly using larger values for $n$.
Schumann attempted to empirically measure the resonant frequencies himself, but it was not until the early 1960s that adequate analysis techniques were available to extract the relevant information from the background noise. It is now well established that the resonant frequencies $f_n$ are 7.8Hz for the base frequency ($n=1$), then 14.3Hz for $n=2$, followed by 20.8Hz, 27.3Hz, 33.8Hz, and so on, but with decreasing intensities. These resonant frequencies are appropriately called the Schumann resonances (SR).
These empirically measured SR are lower than the theoretically predicted ones, which is due to the fact that the Earth-ionosphere cavity is not an ideal cavity. In other words, the electromagnetic waves actually travel at speeds slightly lower than the speed of light $c$, thus causing the resonant frequencies $f_n$ to be lower than initially predicted by Schumann. Furthermore, there are external influences that cause variability in the SR and their intensities. For example, the height above the Earth's surface of the lower boundary of the ionosphere differs between day and night, causing corresponding diurnal fluctuations in the SR. Also, Earth-directed solar flares tend to increase the SR intensities, due to the resulting increased ionization in the lower ionosphere.
Geomagnetic activity and human health
Such increased geomagnetic activities (i.e., geomagnetic "storms") have been known to disable satellites, disrupt telecommunication services, or even knock out electric power grids. Moreover, there is experimental evidence that they also influence human beings. Viacheslav Krylov from the Russian Academy of Sciences writes:
"For a long time, most scientists have cast doubt on the possibility of biological responses to geomagnetic activity. The main reason for these doubts is that the energy of geomagnetic fluctuations that comprise geomagnetic activity is much lower than the thermal noise of biological systems. Despite all doubts, the number of empirical findings describing significant correlations between geomagnetic activity and biological parameters has steadily increased over time."
Krylov presents an impressive list of references with such empirical evidence, and discusses some potential mechanisms. One possibility is that the normal daily variation of geomagnetic activity influences the daily biological rhythms, such as sleep rhythms, of humans and animals. Animals and humans could perceive geomagnetic storms as a disruption of their rhythms.
In fact, SR occur in the same frequency range (0-100Hz) as human brain waves, which are also electromagnetic in nature. Therefore, it has been suggested that SR could resonantly interact with and influence human brain wave patterns, which in turn influence the production of hormones such as melatonin. In animals, melatonin is involved in the synchronisation of circadian rhythms including sleep-wake timing, blood pressure regulation, seasonal reproduction, etc. Thus, a disturbance in the normal daily SR variation could result in a disturbance in melatonin production, which in turn is well known to have potential health effects. But alternative mechanisms have been proposed as well.
In short, solar activity (such as solar flares) affects geomagnetic activity (including SR), which is believed to potentially affect human health. There is statistical evidence to support this, mostly in the form of sophisticated correlation analyses. However, mathematicians could be of great help in the efforts to better understand (or refute, for that matter) the details of the proposed underlying physical and biological mechanisms, involving electromagnetic wave frequencies, intensities, and resonance patterns.
Keeping track of geomagnetic storms and SR
As citizen scientists it is possible to keep track of solar flares, geomagnetic storms, and SR ourselves. For example, NASA provides up-to-date information about solar flares and potential Earth impacts. The following short movie shows the Sun's surface activity over the past 48 hours, and is updated continuously. You can find this movie and related data on the NASA website.
Solar flare impacts can cause geomagnetic storms and the intensity of these storms is measured by the Planetary K index (Kp). A Kp index between 0 and 3 (green in the chart below) indicates a stable and calm magnetosphere. A value of 4 (yellow) means an unstable magnetosphere. A value of 5 or higher (red) indicates geomagnetic storm conditions. The most recent Kp indices for the past three days (at three hour intervals) are provided by National Oceanic and Atmospheric Administration (NOAA):

NOAA also provide a geomagnetic storm forecast, giving probabilities of storms of various intensities happening over the next three days, and the expected Kp indices, again at three hour intervals. The latest forecast is as follows:
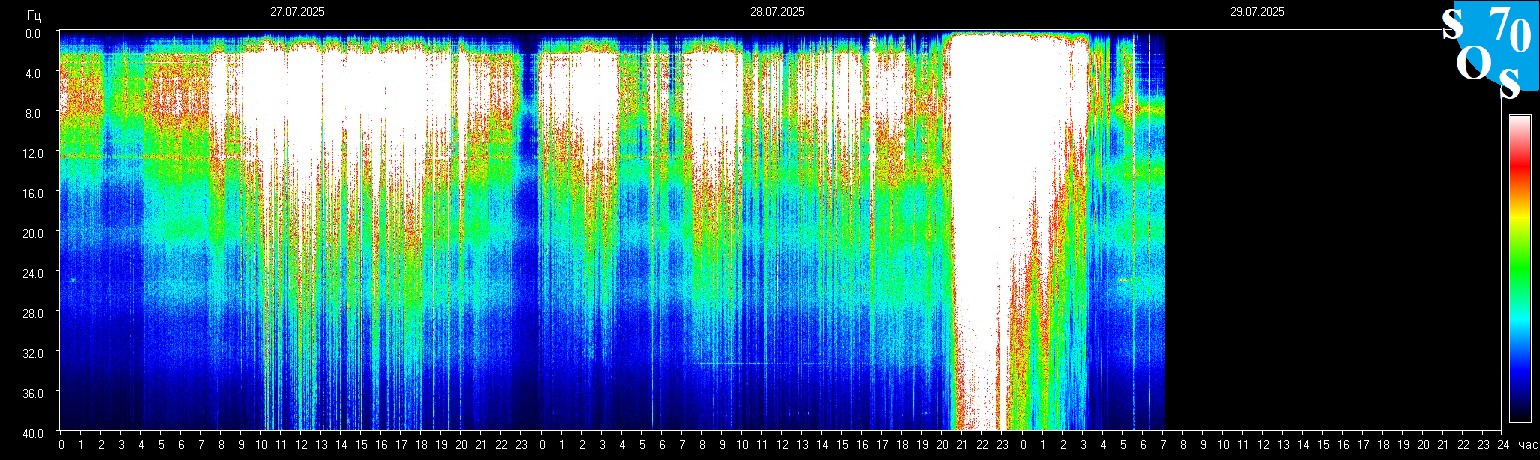
Finally, geomagnetic storms can influence SR intensities. The Space Observing System at Tomsk State University in Russia monitors the SR continuously. They provide an overview of the frequency intensities over the past three days, the most recent graph of these is shown below. In this graph, blue means low intensity, green intermediate, and white high. Frequencies are on the vertical axis, from 0Hz (top) to 40Hz (bottom). The SR show up as green or white horizontal bands.
So, with this publicly available data it is possible to continuously monitor current and potentially upcoming geomagnetic activity yourself. All the charts and graphs in this article are live feeds from the various government or university sources. Simply reload this article page again tomorrow, next week, or any time in the future to get the most recent data!
About the author

Wim Hordijk is a computer scientist currently on a fellowship at the Institute for Advanced Study of the University of Amsterdam, The Netherlands. He has worked on many research and computing projects all over the world, mostly focusing on questions related to evolution and the origin of life. More information about his research can be found on his website.
Comments
Michael Lightfoot
Wow. I can't say I really felt it per se but what a long stretch of the Schumann spiking at high levels