
There is something special about the sporting rivalry between Australia and Britain. Neither country likes to let a chance go by to proclaim its sporting superiority. Whether it's competing for the oldest prize in world cricket — The Ashes — or battling for 102nd in the global tiddlywinks competition, you will always hear the cries of "whinging Pom" echoed by "Aussie convict".

Olympic cycling: sit back and relax?
As an Australian, I have become used to my team coming out on top in contests with our old rivals, however all that was reversed in the 2008 Beijing Olympics, with the British team surpassing even their own expectations to finish fourth in the total medal count ahead of Australia in fifth.
Australians tried to take this with good humour by suggesting that Britain only did well in sports where you sit down (rowing, cycling, equestrian), but deep down we were concerned. My generation doesn't know what it's like to lose to the old enemy!
But should we really be surprised by the British successes at the 2008 Olympics? Over the last few years in the lead-up to the London 2012 Games, there has been a massive influx of money in the UK into Olympic sports and infrastructure. Australia showed a similar improvement ahead of the 2000 Sydney Games, with an improved performance in 1996 leading up to Australia's best Olympic result since 1956 — a Games also hosted by Australia in Melbourne. Since 2000, Australia's performances have declined.
It would seem that hosting the Olympics has an effect not only on how the host country performs at the hosted Games, but at the Games before them.
Looking at the results of the Olympic Games since World War II, we can see that the UK and Australia recorded their best results in their home Games, and their results declined in the following years. We have removed the 1980 (hosted by the USSR) and 1984 (hosted by the US) Games, as boycotts by the US (in 1980) and the USSR (in 1984) — the two big Olympic players before the rise of China — disturb the results.
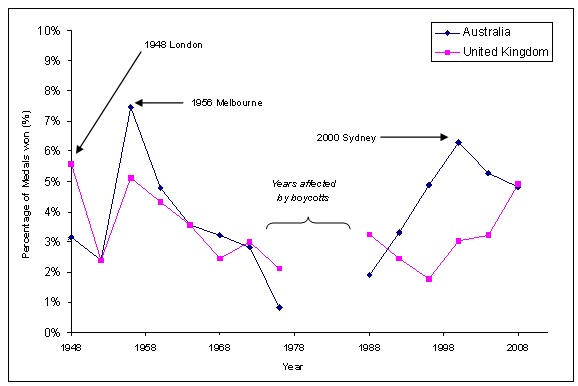
The percentages of medals won by the UK and Australia between 1948 and 2008.
Extending this analysis to all countries that have hosted Games post WW2 (excluding 1984 and 1988), we can see quite clearly that as a country builds towards its home Games, its results improve. In the Olympics following the hosted Games, the results trend downwards. The following chart shows the average performance of the home country in terms of the percentage of medals on offer that were won. Each country is evenly weighted.
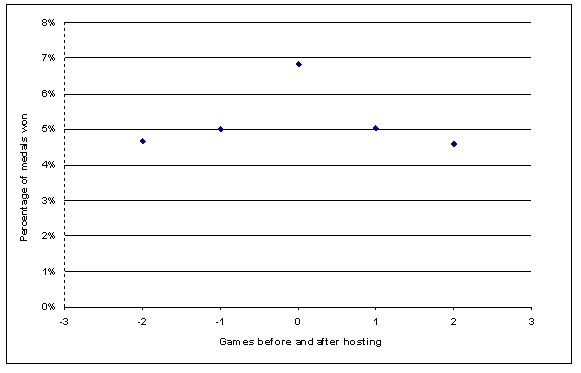
Percentage of medals won by the host nation, averaged over the years in question.
Another way of looking at this is to compare a country's results to its home success. Scaling the home results to 1, we can see that a country's success two Games before hosting is just under 60% as good as the home result. This increases slightly the Games before hosting. The home result is roughly 1.5 times as successful as the Games immediately preceding and following. This method is perhaps more accurate than a direct look at medal count (or the percentage of medals won), as this result is largely influenced by the US, which overpowers the results of smaller countries, such as Mexico.
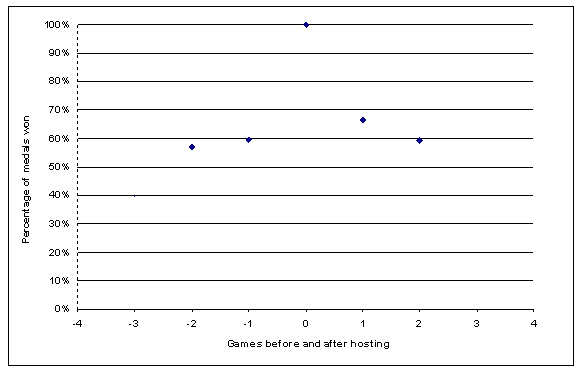
Home results compared to results from previous and subsequent Games.
Of the thirteen countries to host post WW2 Olympics, only Canada and Finland have failed to achieve their best post-war results when they were host (discounting the boycotted 1980 and 1984 Games). Finland achieved its best result one Games before being host. Australia's 2000 Sydney result is only surpassed by its 1956 Melbourne result.
What about gold medals?
The official Olympic rankings are determined by gold medal count, as opposed to the total medal count we have used here. The reason we have used total medal count is simply because it gives us more data and is more representative of a country's achievements. But what about gold medals? Does hosting the Games boost your gold haul?
The following data shows the gold medals and total medals won home and away in the post WW2 era (without those boycotted years), and also the gold percentage of the total medal count:
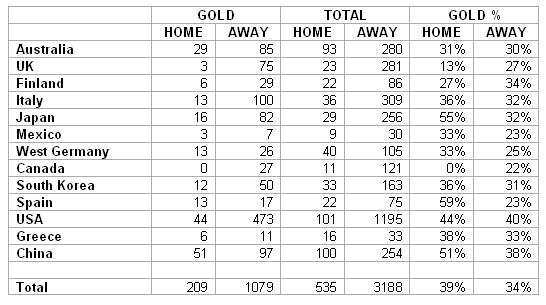
Gold medal count. See below for a caveat concerning West Germany.
Ten out of the thirteen countries who have hosted post WW2 Games have a higher percentage of gold medals as part of their overall haul when at home compared to when away. Overall, 39% of the home country's medal haul is gold, compared to 34% when away.
So what next for the UK?
If these results are to be believed, there will be more misery for Australia in 2012, who will be beaten quite easily by the UK. If the Poms increase their medal share by a factor of 1.5, then they will claim around 7.4% of all medals on offer in London. Judging by past results, this will put them either in 3rd place, if they can sneak past the Russians, or 4th place in the overall medal tally. The UK should also increase their gold medal share.
The 2012 Olympic programme features 26 sports in a total of 39 disciplines. It's difficult to determine in advance how many medals will be awarded in a Games, but going on the Beijing numbers (302 gold, 303 silver and 353 bronze medals awarded — 958 in total), our bold prediction for the British team is...
Australia's results will be largely free of any hosting benefits it gained in 2000. It must be about time to bid again! (And apparently we are.)
Mathematical disclaimers
- We have limited data — 14 Games. The reason we have chosen to look at the years post WW2 is that before WW2, the Olympic Games were not well attended simply due to the costs of sending a team overseas. Also, as it was so much easier, comparatively, for the home team to send athletes to compete, the home team's performance was greatly enhanced — the US won 86% of the medals on offer at their home Olympics in 1904.
- There are many other factors affecting a team's performance. These include the amount of money spent on the team and the country's population. Plus has taken a look at some of these ideas in the article Harder, better, faster, stronger.
- As in all systems, there are unexpected results. When Montreal hosted the Olympics in 1976, Canada won zero gold medals!
- West Germany merged with East Germany for the 1992 Games. I only looked at the West German results for this analysis, as it is impossible to be consistent after its merge with the East.
- When examining the medal share of countries before and after their host Games, only years not interrupted by the boycotts were examined.
- There is always the chance that the UK simply over-performed in 2008...
Games examined
1948 Great Britain, 1952 Finland, 1956 Australia, 1960 Italy, 1964 Japan, 1968 Mexico, 1972 West Germany, 1976 Canada, 1988 Korea, 1992 Spain, 1996 US, 2000 Australia, 2004 Greece, 2008 China.