
Comparing and communicating small lethal risks is a tricky business, yet this is what many of us are faced with in our daily lives. Ideally we need a "friendly" unit of deadly risk. A suggestion made in the 1970s by Ronald Howard is the use of the micromort: a one-in-a-million chance of death. This is attractive as it generally means that we can translate small risks into whole numbers that can be immediately compared. For example, the risk of death from a general anaesthetic (not the accompanying operation), is quoted as 1 in 100,000, meaning that in every 100,000 operations we would expect one death. This corresponds to 10 micromorts per operation.
We can also consider the 18,000 people who died from "external causes" in England and Wales in 2008. That's those people out of the total population of 54 million who died from accidents, murders, suicides and so on (see the Office of National Statistics website for more information). This corresponds to an average of $$18,000 / (54 \times 365) \approx 1 micromort per day, so we can think of a micromort as the average "ration" of lethal risk that people spend each day, and which we do not unduly worry about. Micromorts are also being used to compare death risks in different countries.
A one-in-a-million chance of death can also be thought of as the consequences of a form of (imaginary) Russian roulette in which 20 coins are thrown in the air: if they all come down heads, then the subject is executed (the chance of this happening is 1 in 220, which is roughly equal to one in a million).
It immediately becomes clear that a measure such as a micromort needs a unit of exposure to accompany it, and we can consider different sources of risk that naturally give rise to different measures of exposure. Here we briefly consider transport risks, medical events and leisure activities. Of course, we can only quote average risks over a population, which neither represent your personal risks, nor those of a random person drawn from the population. Nevertheless they provide useful ballpark figures from which reasonable odds for specific situations might be assessed. How you interpret these numbers depends on your philosophical view about what probabilities really are. Do they exist as properties of the external world, in which case the assessed odds can be considered estimates of the "true" risks, or are they only subjective judgements based on currently available information? We favour the latter interpretation.
Transport
Options for comparing forms of transport include miles-per-micromort, micromort-per-100-miles, micromorts per hour and so on. We compare the first two options below: although the general advice is that larger numbers should correspond to larger risks, miles-per-micromort seems attractive, especially when used to provide a calibration against other risks, as described below. See the figures below for how far you can travel per micromort and to see micromort per distance travelled using different modes of transport.
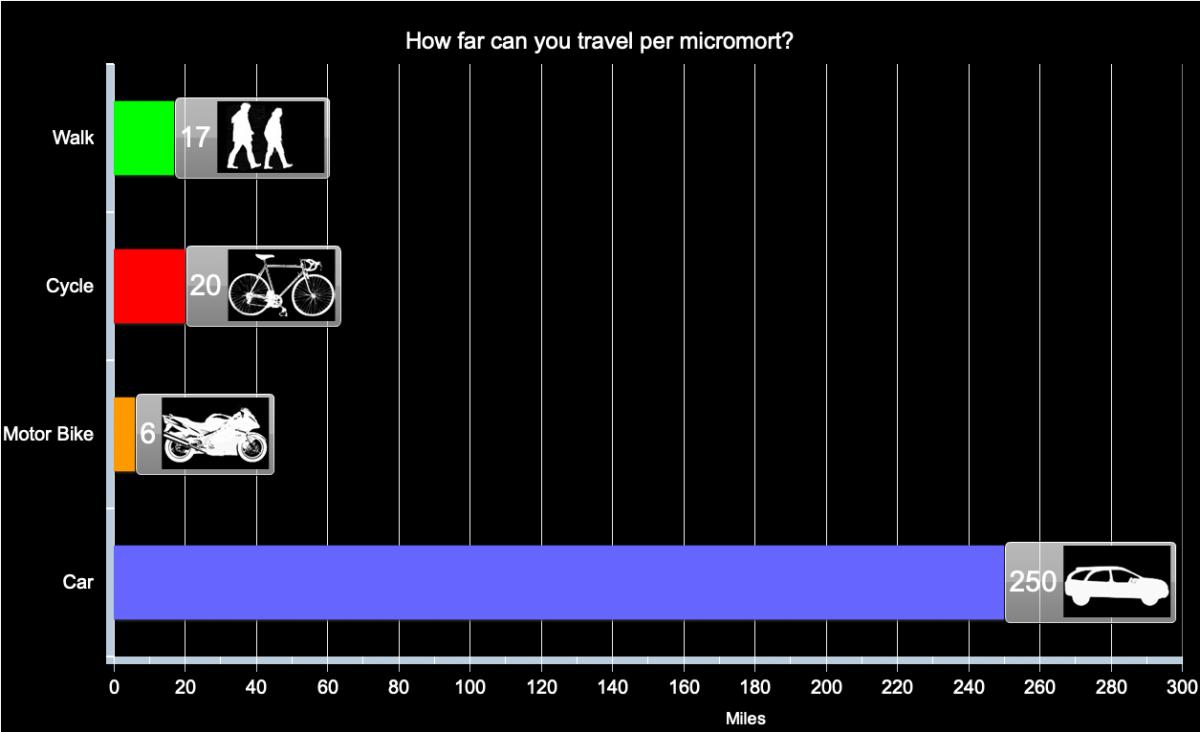
Distance travelled per micromort (one-in-a-million chance of death) for different forms of transport in the UK, based on assumption of constant risk within transport type and over time.
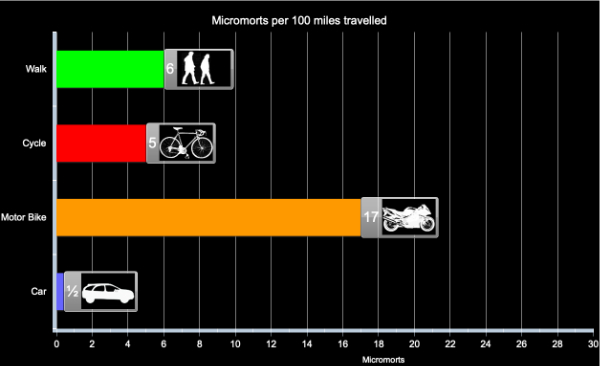
Micromorts per distance travelled for different forms of transport in the UK, based on assumption of constant risk within transport type and over time.
Medical events
What about going into hospital? Each day in England around 135,000 people occupy a hospital bed and inevitably some of these die of their illness. But not all these deaths are unavoidable: in the year up to June 2009, 3,735 deaths due to lapses in safety were reported to the National Patient Safety Agency, and the true number is suspected to be substantially higher. This is about 10 a day, which means an average risk of around 1 in 14,000, assuming few of these avoidable deaths happened to out-patients. So staying in hospital for a day exposes people, on average, to at least 75 micromorts. This is equivalent to the average risk of riding 420 miles on a motorbike, say between London and Edinburgh. The conclusion: hospitals are high-risk places.
Medical events are specific discrete occurrences, so the natural measure is risk per event, for example giving birth, having a Caesarean section, having a general anaesthetic. The exception is spending time in hospital, which is expressed as micromorts per night spent in hospital.
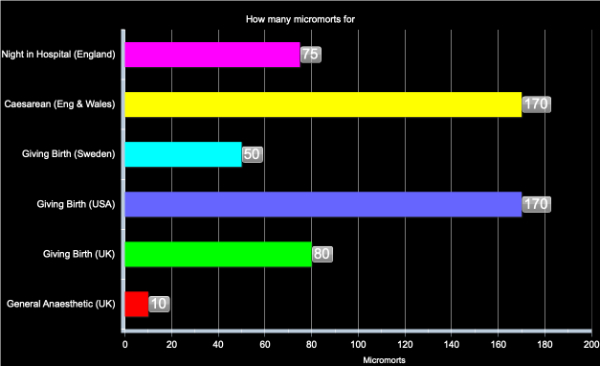
Micromorts per medical event in England in 2008, based on assumption of constant risk within event type and over time.
Comparison of the numbers for transport and health are informative: for example having a general anaesthetic carries the same risk of death, on average, as travelling 60 miles on a motorbike. The high value for a night in hospital is derived from National Patient Safety Agency reported adverse events resulting in death: reasonable probabilities may be considerably greater than this value.
Leisure activities
We assume that the risk comes from a specific accident in what is otherwise a safe activity with no chronic ill-effects. It is therefore natural to look at micromort per activity. The activities take different lengths of time, so it would be possible to express the risks as micromorts per hour, but this does not seem to reflect the choices that people make. Instead, we look at micromorts per episode, that is micromorts per horse ride, per scuba dive, etc.
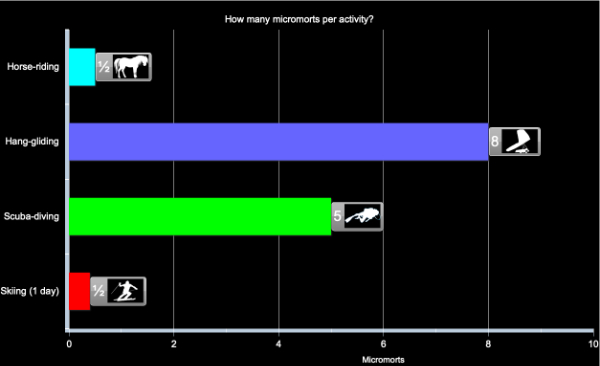
Micromorts per activity, based on assumption of constant risk within activity and over time
All these examples concern sudden deaths, but many risky behaviours have a delayed impact, such as smoking or an unhealthy diet. Comparing acute and chronic risks is tricky, but there have been a number of suggestions for "riskometers" which attempt to put both immediate and delayed risks on a common scale. Options include
- Listing causes of death, which allows a comparison of how many people, for example, die from accidents compared to heart disease, but does not directly allow the comparison of alternative daily activities.
- Transform lifetime risks, say of dying from cancer due to smoking, into risk per day by assuming, say, around 30,000 days in a lifetime. No allowance is made for delayed effects.
Other more complex options have been suggested, but none seems entirely satisfactory. But a useful image may be as follows. Each of the acute risks described above could be considered a lottery with a million tickets — if you expose yourself to a micromort it is like being given a ticket in this lottery, and if your number comes up then sadly it is the end of your life. However if you do not "win" this bizarre lottery, then you can throw away your ticket and start another risky day with a clean slate.
However with chronic risks such as smoking and bad lifestyle, you get given tickets as you puff away and stuff yourself with junk food. but you don't get to throw the tickets away — they keep on accumulating and as the lottery draw gets made each day your chance of winning get higher and higher.
So try not to collect too many tickets.
About the authors

David Spiegelhalter

Mike Pearson
David Spiegelhalter is Winton Professor of the Public Understanding of Risk at the University of Cambridge.
Mike Pearson created the figures for this article.
Mike, David and the rest of their team run the Understanding uncertainty website, which informs the public about all issues involving risk and uncertainty.