
This article is based on a talk I gave at the recent John Cage exhibition in the Kettles Yard gallery in Cambridge. Cage is perhaps best known for his avant-garde music, particularly his silent 1952 composition 4′33″ but also for his use of randomness in aleatory music.
But Cage also used randomness in his art. The Kettles Yard exhibition featured wonderful film of assistants reading computer-generated random numbers off a list, which determined which of a row of stones were to be chosen, which brush to use, and the position of the stone on the paper; Cage finally paints around the stone, stands back and announces the results as "beautiful". He also dictated the use of chance in the form of the exhibition, and Kettles Yard used computer-generated coordinates to determine the heights and positions of the pictures, removing and adding pieces during the exhibition using a random process.

The John Cage exhibition at Kettles Yard.
In this process Cage is deliberately sacrificing some control: "I use chance operations instead of operating according to my likes and dislikes". It is important to distinguish this approach from artists such as Jackson Pollock, whose work may at first appear haphazard but is a form of controlled expression. Pollock claimed that no chance was involved: "When I am painting I have a general notion of what I am about. I can control the flow of paint, there is no accident just as there is no beginning and no end" and in these paintings "I want to express my feelings rather than illustrate them." (You can find out more about mathematical aspects of Pollock's art in the Plus article fractal expressionism.)
Other artists using artificial randomising devices as an integral part of their work include Ellsworth Kelly in Spectrum Colors Arranged by Chance II, 1951, while Kenneth Martin's Chance and Order pictures were created in the following way: "The points of intersection on a grid of squares are numbered and the numbers are written on small cards and picked at random… A line is made between each successive pair of numbers as they are picked out".

Kenneth Martin's Chance and Order.
I am personally not so keen on Cage's work, but was awed by an exhibition at the Serpentine Gallery in London of Gerhard Richter's 4900 Colours: Version II. This is based on 196 panels each comprising a 5 x 5 square. A computer program assigned a colour to each square drawn at random from a palette of 25 colours. The 196 panels can be put together to form one huge display, or in the Serpentine exhibition were arranged at random in sets of four to form forty-nine 10x10 displays. The video below shows the hanging process.
It is remarkable how "non-random’" the panels look, with some dominated by particular colours which are often placed next to each other. But the whole point of "pure" randomness is that apparent patterns are expected to occur: the number of times that lottery balls turn up makes a predictable pattern (see the Plus article A league table lottery), while when flipping a coin 20 times there is a 77% chance of a run of at least 4 heads or tails.
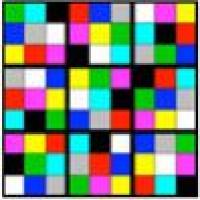
My examples of Richter-like displays are shown below using nine colours chosen at random within each square of a 9x9 grid. There are often apparent clusters and patterns in the colours. Can you spot the fake piece of random art?

Four 9 by 9 colour squares - can you spot which one is not random?
Other uses of pure randomness
Randomness has been extensively used in designing experiments in agriculture and medicine. When comparing treatments, whether fertilisers or medicinal drugs, we want to make sure that the differences observed are due to the intervention and not due to the land or the patients being different. In medicine we generally allocate patients to treatments at random (see Plus article Evaluating a medical treatment). In agriculture a more structured approach is possible.
A classic design is the Latin square. Suppose one wanted to compare eight different fertiliser regimes, then a field can be divided up into 64 squares arranged as an 8x8 grid, and one of eight regimes applied once in each row and column in order to make sure that the different "treatments" are balanced across the field. Examples of 8x8 and 9x9 Latin squares from Fisher and Yates' book of statistical tables (1938) are shown below, in which the letters correspond to a treatment. This is a very different process from Richter's. The design is highly structured, with the only randomisation being the choice of a particular Latin square and the allocation of colours/crops to the letters A, B, C,...

Examples of Latin squares.
Gonville and Caius College in Cambridge has a stained glass Latin Square in tribute to Fisher – I have copied this idea and constructed the 8 x 8 example above as a stained glass panel.

The author's rendition of Fisher and Yates in stained glass.
A special Latin square
The second example (top right) of my "random art" above is the odd one out, and is highly non-random. It is a Latin square but the image below reveals it to have been carefully chosen to have rather special properties.

A special latin square.
We quickly see that it is a solution to a Sudoku puzzle, with each colour appearing once and only once in each 3x3 subsquare. Sudoku can be said to have arisen in agricultural field experiments. The statistician W.U. Behrens introduced the idea of gerechte designs in 1956, in which each of n crop varieties would also appear only once in a sub-area of size n, and in 1977 the statistician John Nelder posed the problem of uniquely completing a Latin square from a critical set of entries that have already been placed in the grid. The architect Howard Garns put these ideas together in 1979 as a number place puzzle, which in 1986 became popular in Japan under the name Sudoku. A Sudoku puzzle is therefore, in formal terms, a critical set for a gerechte design for the 9x9 grid partitioned into 3x3 subsquares.
But the example shown above is particularly special. We first need to define a "broken row" and a "broken column". A broken row, for example, is a set of three corresponding mini-rows in three vertical sub-squares as shown in the figure below.

Broken rows.
The image shown above represents a symmetric Sudoku solution: each colour occurs once in each column, row, and 3x3 sub-square, as is the case with any Sudoku puzzle. But in addition, each colour occurs only once in a given position in a sub-square, broken row and broken column. The mathematicians Rosemary Bailey, Peter Cameron and Robert Connelly recently proved there are only two such patterns, using an elegant combination of coordinate geometry and coding theory: it is left as an exercise for the reader to show that the pattern shown above can be completed after specifying the 14 entries shown below.

The critical set for one of the two symmetric Sudoku solutions.
All I have to do now is make this into a stained glass window.
About the author
David Spiegelhalter
David Spiegelhalter is Winton Professor of the Public Understanding of Risk at the University of Cambridge. David and his team run the Understanding uncertainty website, which informs the public about issues involving risk and uncertainty.