
So what's the problem?
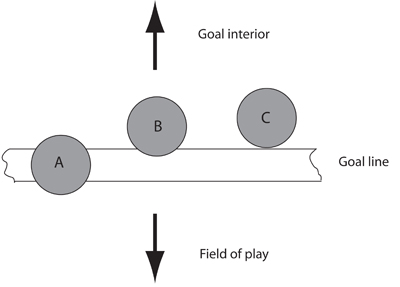
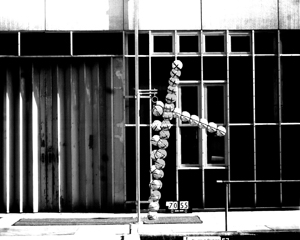
Graphic 1: The definition of a goal.
The definition of a goal has been clear ever since football codified its rules in the mid-19th century: for a goal to be scored, all of the ball must cross all of the line. So in the diagram on the right, C is a goal whereas A and B are not. Most disputed goals result from defenders illegally returning the ball into play after it has crossed the line, but significant numbers occur without any human intervention at all. Perhaps the most famous example is Geoff Hurst's second goal at the 1966 World Cup final between England and West Germany. His shot cannoned off the crossbar and was judged to have bounced behind the goal line before rebounding back into play.
There have been other controversial examples over the years. After Hurst's, the highest-profile incident occurred at the 2010 World Cup in the second round match between England and Germany (again!), when Frank Lampard's shot struck the crossbar and bounced a good half-metre behind the line. On this occasion the goal was disallowed by the match officials, but hundreds of millions of viewers around the world saw it repeated in high-definition, slow motion replays.
Why such incidents occur is perplexing at first sight. In the diagram below the ball hits the bar and because the ball is travelling towards the rear of the goal, surely it will continue in that direction after striking the ground? This ignores the considerable backspin the ball acquires in its contact with the bar.
If this spin is great enough the ball's horizontal velocity can be reversed when it bounces on the ground and if it doesn't bounce too far behind the line it can clear the crossbar in the recoil, and bounce out. This event is so fleeting, only two tenths of a second from bar to ground, that it's hardly surprising that referees make snap decisions which are often incorrect. (You can find out more about ball spin in the Plus article If you can't bend it, model it.)
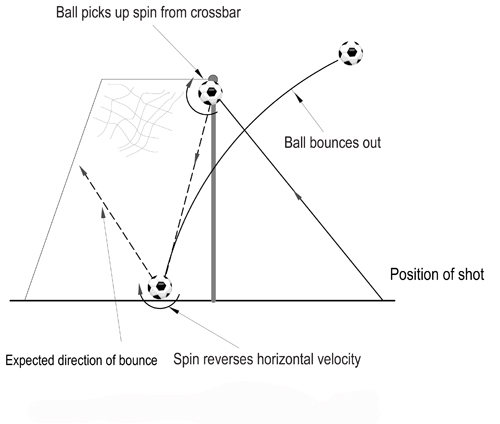
Graphic 2: Spin reverses the ball's direction.
We set out at the University of Bath to investigate this behaviour. Can a ball be made to reverse its velocity under experimental conditions and what are the important factors that govern this behaviour?
Machines are more consistent than footballers
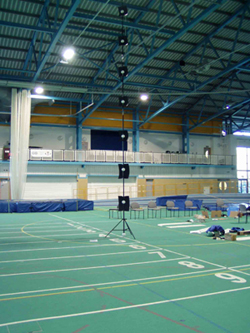
For our study we used a programmable ball launcher. This was absolutely essential because no professional, not even one with the skills of a David Beckham, could repeatedly fire shots at an experimental crossbar with sufficient accuracy to ensure that all of the critical events would occur. The photo below shows how our experiment was set up.
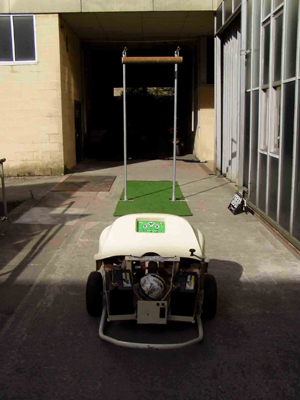
Graphic 3: The ball launcher.
To film the impacts a high-speed digital camera was situated to the side of the experiment so that it filmed the path of the ball as it travelled towards the crossbar. Over 50 impact events covering a range of speeds and launch angles were recorded. The photos below show two examples in freeze frame format. One is clearly a goal, the ball bouncing too far behind the goal line to spin back. The other shows the ball's direction reversing with the ball rebounding back into play. Just how we turned these images into data files where accurate positional coordinates, ball velocities and spin rates could be obtained is explained in the section which follows.
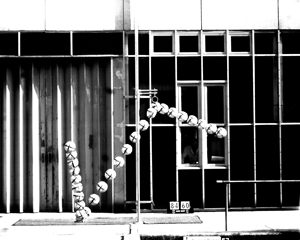 Graphic 4: This is a goal. |
 Graphic 5: And this is not. |
From digital images to real-world coordinates: the DLT method
High-speed video can be enormously helpful in developing sporting excellence in a coaching context but it is practically useless if quantitative measures are required. Such questions as "how fast is that athlete running" or "what forces are acting on the ball" can only be answered if the movement field is in some sense calibrated. This is sometimes done by introducing devices such as measuring rods in the digital camera's view, but there is no guarantee that the camera reproduces its images linearly right across the field and so a more sophisticated technique is needed for accurate work.
Let's suppose a ball is moving with real-world coordinates $(x,y)$ given in metres relative to a fixed origin \textbf{$(0.0)$}. A camera will record an image which can later be analysed on a computer screen. Suppose the ball's position in this virtual world is $(u,v)$ where $u$ and $v$ are conventionally measured in pixels. By looking at a mapping of the real-world coordinates through the camera lens onto the screen it can be shown that $(u,v)$ and $(x,y)$ are related by the following equations: $$u=(L_1x+L_2y+L_3)/(1+L_7x+L_8y)$$ $$u=(L_4x+L_5y+L_6)/(1+L_7x+L_8y)$$(See here for details on how to derive these equations.)
Graphic 6: A vertical pole with marker points.
Of course, we don't stop there. A minimum of four calibration points would not produce very accurate results and the aim is to spread the calibration throughout the entire movement field. This can be done in a variety of ways but one common method is to use a vertical pole with marker points placed very accurately along its length (see the photo on the left). Then by stepping the pole through a series of known positions and photographing these using the camera we can build up a calibration grid. This introduces lots of redundancy into the problem. A hundred calibration points would generate 200 equations from which all different combinations of eight equations in the above format can be chosen and solved. Simple averaging then gives accurate values of the DLT coefficients.
The computation is quite intensive, but a mathematical software tool, such as Mathcad, can handle simultaneous equations and makes very short work of the process. All that remains is to film a sequence of ball impacts against the crossbar and the ground. For these, the ball is appropriately marked so that its spin can be tracked throughout the flight. There follows a long, tedious sequence of digitising, during which the will to live can occasionally be questioned. However, long careful digitising sessions are good for the souls of aspiring engineers and (occasionally) their supervisors.
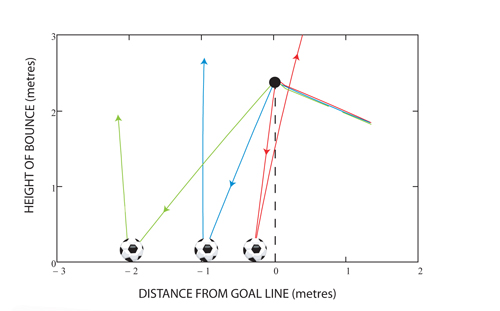
Finally, having determined the true coordinates of the ball as described above, trajectories can be fitted to the data. Pre- and post-impact velocities together with the ball's angular velocity quickly follow. The diagram below shows an extract from the processed data where the ball's position is tracked through a short sequence illustrating a goal (the green path), a bounce where the forward velocity is arrested (the blue path) and finally one where the horizontal velocity is reversed (in red).
Graphic 7: Extract from data showing measured trajectories.
What do these experiments tell us?
The results confirm the importance of spin acquired during the ball's impact with the crossbar and show that under the right conditions a ball can easily cross the line and rebound back into play, to the consternation of both the players and the match officials. In our work, the critical zone – the region behind the goal line from which a spinning ball would bounce out – was very narrow, about 35cm, not much greater than the ball's diameter of 22cm. This was because our surface was very hard, leading to a mean coefficient of restitution (a number measuring the elasticity of the impact) of 0.75. It is generally accepted that natural playing surfaces have much reduced coefficients compared with synthetics, typically as low as 50% of the synthetic value for really soggy turf. So we set out to use our data to model crossbar impacts with coefficients typical of natural surfaces.
In doing this we used a simple model of the ball's impact with the surface. Both were assumed to be rigid, the elasticity of the bounce being modelled by using appropriate coefficients. By considering the linear and angular momenta before and after impact it is possible to formulate simple equations relating pre- and post-impact velocities and spins. For the horizontal and vertical velocity components we have:
\begin{equation}V_h^1=(3V_h-2rs)/5\end{equation} \begin{equation}V_v^1=eV_v.\end{equation} In these equations, $V$ and $V^1$ are the pre- and post-impact velocities. The suffixes $h$ and $v$ denote the horizontal and vertical components. The coefficient of restitution is $e,$ $r$ is the ball's radius and $s$ the spin acquired during the ball's impact with the crossbar. A glance at (1) shows that the horizontal velocity will be reversed if $s>3V_h/2r$ because if this is the case the velocity changes sign. A quick calculation confirmed that this was so for certain values of these quantities in the experiments.Typical spin rates and recoil velocities following the ball's impact with the crossbar were taken from our measurements: these were 75 radians per second and 17 metres per second respectively. A coefficient of restitution of 0.45 (60% of our measured values) was used to reflect the generally softer playing surfaces encountered in practice. The ball was assumed to be projected downwards at a range of angles following impact with the bar. The post-bounce conditions could then be determined from (1) and (2) and the ball's trajectory after the bounce determined assuming that it subsequently moved under gravity alone.
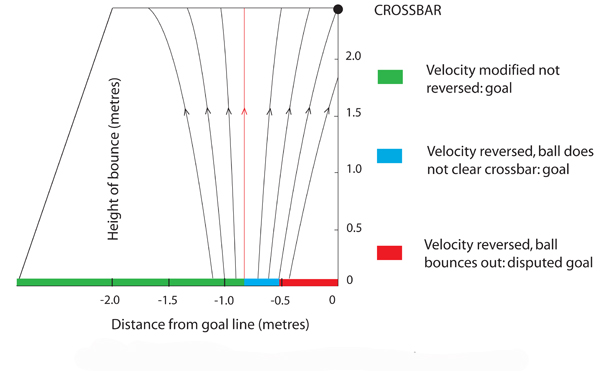
The diagram below shows the results. The ball's behaviour has been modelled from the point where it stops moving horizontally (the red trajectory) to the point where the reversal of the ball's motion would lead to a second impact with the crossbar as the ball bounced out. Impacts in the green zone would lead to a conventional goal; the ball's velocity is modified but not reversed. Within the blue zone the ball reverses but the ground impact positions are too far from the goal line to enable the ball to escape by clearing the crossbar. Red is the danger area. Under the assumed conditions, balls bouncing here would be returned into play. The coefficients used (60% of our experimental findings) show that the critical impact zone extends to 54cm behind the goal line. This is in very good agreement with Frank Lampard's 2010 World Cup goal described earlier.
Graphic 8: Modelled impacts and progression to bounce-out.
The case for goal line technology
Following the farrago of England's nongoal at the 2010 World Cup, FIFA, the organising body for international football, seems to have had a change of heart concerning the role technology might play in this important area. At the time of writing two possible solutions are under intensive investigation: England's Hawk-Eye system relies on visual tracking of the ball and its rival, the Danish product GoalRef, on an electronic device in the ball's interior. Both must report the ball's position relative to the goal line with high precision and it seems that a choice will be made by FIFA in Kiev, immediately following the final game of the Euro 2012 tournament. The most likely timing for its introduction would then seem to be the 2013-14 season for the English Premier League; but given that Major League Soccer starts earlier in 2013, the United States may well pioneer the system. Watch out America!
Of course if either system does its job it doesn't matter whether the goal resulted from a crossbar impact or not. But suppose the evaluations are inconclusive. Then it might be profitable to think about mitigation measures to eliminate crossbar impacts as an important source of disputed goals. This could be done by making crossbar impacts "spin neutral" and we at Bath have some ideas on the matter. Let's see what happens.
About the author

Ken Bray is a theoretical physicist and a Senior Visiting Fellow in the Faculty of Engineering and Design at the University of Bath, UK. He has made a special study of the mathematics of football and the factors affecting the ball's flight, and has lectured, broadcast and published widely for both academic and general audiences. He has gone on record as saying that as much as 30% of a footballer's technique is down to an intuitive understanding of maths and science (although they shouldn't go anywhere near a computer!).
His book How to score: Science and the beautiful game has been reviewed in Plus. The author gratefully acknowledges provision of the experimental ball launching machine by the BOLA company of Cotham in Bristol.
© Ken Bray Elliptica Ltd 6 June 2012