
For all the joy children bring into your life, they can also make you ill. Schools are mixing pots of infection. Whatever strain of flu or cold is making the rounds, kids will carry the bugs back home and out into the wider community.
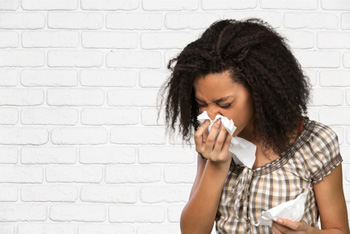
Schools are hotbeds of infection.
This presents a problem for epidemiologists trying to understand and predict flu epidemics. To get their predictions right, they need to understand the contact patterns of children at school. Since nobody has the time to hang around schools for days on end, tracking a large number of individual children, this information is hard to come by. An alternative is to get the kids themselves to collect it. This is what a team of epidemiologists at the London School of Hygiene and Tropical Medicine (LSHTM) and the University of Cambridge have done — at the same time giving the students a glimpse of research in action, and how the maths they learn at school is used in the real world.
"Getting the kids involved is the best way of doing this kind of research," says Adam Kucharski, one of the researchers involved in the project. "They know the school's set-up and they know what kind of methods are going to work. Getting them involved in the analysis of the data can also give you better insights: if there is something unexpected in the data, they will have a better understanding of what's going on. The added benefit is that we are engaging students with scientific research. The students were involved pretty much from start to finish."
Together with Clare Wenham of LSHTM and Andrew Conlan of Cambridge, Kucharski recruited four schools to take part in the project in collaboration with the Millennium Mathematics Project. The work was funded by the Wellcome Trust. At four or five different times over the school year students in year 7 (that's 11 to 12-year-olds) were asked about their contact patterns and whether they had recently had flu or cold. The questions were the same for all students and schools — and they weren't asked by the researchers, but by older year 10 students at the same school. "We thought the project would work better if it was student-led," says Wenham. (You can see the questions that were asked here.)
A main aim was to see what a typical contact network looks like, not just on one particular day, but over a period of time. "We already had lots of data on mixing patterns, and who interacts with who, but it almost always came from single time points," says Kucharski. "You go in, get the data, and that's that. But there's no knowledge if that's the real pattern. If you go back next month, will you get the same result? What we really wanted to do is see how those social networks change over the course of the school year." A good way of understanding these social patterns is to draw the network, plotting a dot for every person and a link between dots if the corresponding people list each other as friends.
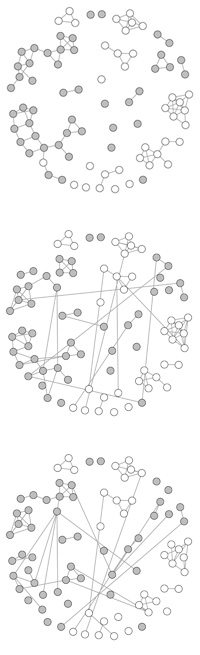
A school network over a period of 3 months (February to April). White are male, grey are female. Lines show mutually reported contacts.
Watching the change in the networks happen over time is fun because, as Kucharski explains, "You can always attach a story to what you see. For example, in one school we saw a big clique of girls and lots of little cliques consisting of boys. But then we plotted the network a month later and found that all the boy groups were consistent while the girls had 'rewired'." An great source for gossip, no doubt, and perhaps some insight into the teenage mind as well.
From an epidemiological view point, however, one burning question is whether some overall features of a network remain the same, even as individuals rewire, making new friends and parting from old. Examples are the average number of friends per person in the network, or the degree to which people tend to cluster in tight-knit groups. These factors are important in the mathematical models epidemiologists use to predict how an infection spreads, so knowing whether they remain the same over time is crucial.
The great thing is that even a little maths can go a long way in answering this question, so the students could be involved in analysing the data they collected. "We converted the data into printed networks," explains Kucharski. "Each node had a number so you could look up more information about it in a spreadsheet; whether it corresponded to a male or female, whether they reported a cold or flu, and so on." Students could then work out quantities like the average number of friends per person, and even the amount of clustering in the network, which can be measured by the number of triangles within it: every triangle in the printed network corresponds to a clique of three people. The preliminary analysis suggests that those quantities, the average number of friends and amount of clustering, often remain fixed over time, which could well have epidemiologists breathing a sigh of relief: if those numbers had a tendency to change, it would be a lot trickier to build a model of a disease spreading through network.
The team worked with the students using a mixture of video conferencing and personal sessions. "I think they particularly liked the data analysis sessions," says Kucharski. "Especially in maths lessons it's quite unusual have a situation where nobody has the answer in advance. We did some sessions around Easter when we had collected most of the data and hadn't really analysed it yet. So we said 'here's the data you collected, but we don't really know what you're going to find'. Those sessions went really well."
And it wasn't just about the maths: student also learnt about what's involved in conducting a survey, including the ethical aspects, such as the need for parental consent or anonymity. "For example, a lot of students may not have seen why anonymity is so important," explains Wenham. "But when you start asking, not only 'who are your friends?', but also 'who don't you want to hang out with?' then that's obviously information people might not want to share. The methods of ensuring anonymity when collecting data is something some of the students found very interesting."
The next step for the researchers is to analyse the data in more detail and publish their results, so their insights can feed into the models used by epidemiologists. They have also produced a set of resources for students in years 8 to 10, showing how maths can be used to understand epidemics, social interactions and vaccination. The resources have been published on our sister site NRICH.