
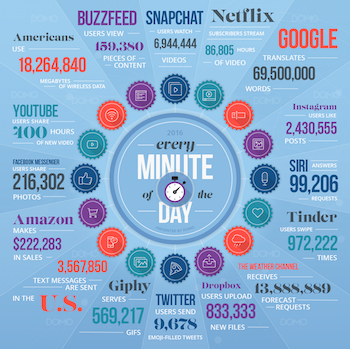
The fourth annual Data never sleeps infographic produced by DOMO
The world around us is changing – the internet and mobile telephony, medical imaging and satellite navigation, social networks, the entire panoply of personal computers, laptops, tablets and smart phones are now ubiquitous in our daily life of work and leisure. We are surrounded by technology that collects, transmits, manipulates and ultimately needs to understand reams of information of an order of magnitude which is hard to comprehend. In 2016, for instance, in every single minute Google translated over 69 million words, over 400 hours of video were uploaded to YouTube and more than 200,000 photos were shared on Facebook Messenger.
Mathematics has historically been the language of physical reality and its success there underpins all of modern science and technology. As noted in an article written with my colleague, Arieh Iserles, given the very nature of information, there is every reason to believe that mathematics is, to an even greater extent, the language of data. This has profound implications for the future of mathematics, as is the ever-present tension between data (values of qualitative or quantitative variables) and information (the content and meaning present in data).
Indeed, it is not the data itself that is so important, but rather the information contained within it. Using fundamental techniques from the mathematical sciences, it is possible to understand the limitations of what can be found from the data, and indeed whether this information can be found in the next few seconds, minutes, hours, or if an algorithm will run forever without ever providing an answer. We can also use maths and stats to understand how certain or uncertain we should be about conclusions we draw from data. Mathematical and statistical foundations are at the heart of the data revolution and they are at the heart of a new group at the University of Cambridge: the Cantab Capital Institute for the Mathematics of Information, (the CCIMI).
The CCIMI grew out of a donation from Cantab Capital Partners and is based at the Centre for Mathematical Sciences, as a collaboration between the Department of Applied Mathematics and Theoretical Physics and the Department of Pure Mathematics and Mathematical Statistics. The Institute hosts research activities on the development of theory and methodology for analysing, processing and understanding information in data. It's made up of more than 30 affiliated faculty, a cohort of six PhD students per year, and we are currently hiring other researchers.
Joining mathematical forces
The exciting thing about mathematics of information is that it is nurtured from a broad variety of different mathematical areas.
Take image denoising – any electronic signal (such as sounds or images) can contain random fluctuations originating from the device producing the signal and from possible disturbances in the environment the signal came from. For example, the image below on the left is a noisy image of a cat. The main aim of denoising is the differentiation between random noise and the actual image contents, to create an image such as the one below on the right.
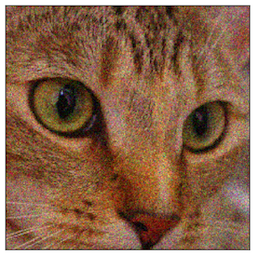
A noisy image of a cat...
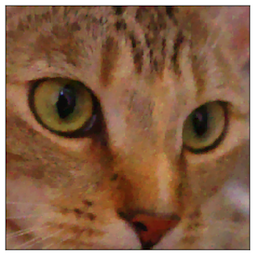
...and the de-noised image. (Photo courtesy of Matthias Ehrhardt)
To do so, we first have to characterise both the noise and the image contents. Noise is often random and to describe it we need probability and statistics. Image contents on the other hand, are most of the time describable by geometric structures of different scales and different types (a house, a chair, the silhouette of a person), and maybe some repetitive, less orderly patterns (textures – such as water, grass, hair), and colour information. To formalise our description of the contents of the image we might encounter geometry, differential equations, and harmonic analysis.
Then, after we have characterised the noise and the image contents, their differentiation often boils down to an optimisation problem. These problems usually have a very large number of unknowns (around the number of pixels in your image). Solving such problems requires maximising some value within some constraints, and uses the mathematics of numerical analysis. (You can find out more about some of these techniques in the Plus article Restoring profanity.)
There are many more examples where different mathematical areas pop up – statistics, analysis, numerics and optimisation, geometry, topology, physics, and many more. I invite you to have a look at the projects showcased on the CCIMI website to see how diverse the areas of mathematics involved are.
Bringing areas together
There are many exciting questions currently being explored in data science. One of the topics in my own field – mathematical imaging – that I am very excited about, is the bringing together of model-based imaging and machine learning.
A lot of research over the last decade has started out with a set of images and particular questions you'd like to answer about those images. Say how do you denoise, or identify objects in, these images. A lot of work has gone into the understanding and formalisation of how to characterise image contents in digital images: what is important, what not; how to deal with incomplete data (eg occlusions – when parts of the target objects in a image are hidden). This research involves contributions from psychologists working in visual perception, computer vision, image analysis, and so on. Approaches originating from these areas are very much model-based. Models are derived for these structures.
On the other hand, in machine learning, the model is learned from the data itself. Instead, this approach starts from a very generic model for the structure of the image, and this model is adapted and refined in response to the data, to running the process over many, many images – the model learns from the images.
These are two very different approaches, and both have their pluses and minuses. The exciting thing is to bring them together which promises to result in more adaptive expert models.
General tools and specific applications
The mathematics of information can be directly stimulated by specific problems in the real world, but it can also be developed remotely from any particular application. One example can explain both of these perspectives: image reconstruction from tomographic data.
Tomography refers to imaging by sections. It is used in various different scenarios, such as producing medical images of the inside of the body (without cutting it open), for seismic and atmospheric imaging, and in material sciences to analyse structures of materials. And this variety of applications is reflected in the different types of tomography that are used.
In magnetic resonance tomography for instance (MRT, or more familiarly called MRI – magnetic resonance imaging), the sectioning/slicing is done by using strong magnetic fields and radio waves to slice the body. The data measured from MRT are, roughly, samples of the Fourier transform of an image of the water density inside the body. The reconstruction task is then to reconstruct an image, showing the water density in the body, from its Fourier samples. (You can read more here about Fourier transforms of images.)
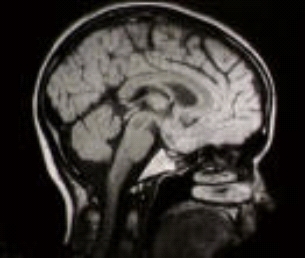
A CT scan of the inside of a head.
In computer tomography (CT) on the other hand, high energy x-rays are slicing through the body. The x-rays are sent into the body with a particular energy. As the x-ray travels through the body energy is accumulated or lost, depending on the type of tissue the x-ray travels through. And at the other end, the energy of the x-ray emerging from the body is recorded.
The data measured from CT is formalised mathematically as line integrals through the various tissues in the body: integrals over the image density along lines of different angles and different positions through the body (you can think of an integral as roughly as the accumulation of something over some interval). The mathematical problem is to reconstruct the image from these line integrals.
And then, there are loads of other imaging techniques in tomography, which add many more sophistications and varieties to the reconstruction problem: positron emission tomography (PET), electron tomography (ET), optical tomography and many more. In each case, the mathematical model varies, depending on the physics of the system used. When designing image reconstruction techniques, of course one needs to formalise and analyse the model for each of these cases separately. The mathematics for each of these cases is different. This is an example of where the mathematics of information is directly fed from a specific application.
On the other hand, there are certain mathematical problems in tomography that can be studied very remotely from the application. Line integrals of a function, for instance, can be analysed using the Radon transform, which was first investigated by an Austrian mathematician, Johann Radon. This year we are celebrating 100 years of the Radon transform. The central question Radon asked was: can you reconstruct a function from its line integrals? This is a question in analysis and geometry, and is per se independent of the particular application it is used for. Indeed, Radon developed the techniques of Radon transforms in the early twentieth century at a time when image tomography did not exist!
Radon transforms are now used to reconstruct images from CT data. (You can read more about tomography and Radon transforms in Saving lives: the mathematics of tomography.) But when computer tomography was invented and people thought about how to reconstruct images from these measurements they could take, they didn't know about Radon and his work. So the first approaches for interpreting CT data were completing independent of these already well developed mathematical techniques. This is another good motivation for an institute like the CCIMI — we don't want this to happen again. We want mathematical theorists to be discussing with people working on particular applications from very early stages of their work, so these exchanges can happen early and accelerate these developments.
About the author
Carola-Bibiane Schönlieb is a Reader in Applied and Computational Analysis at the Department of Applied Mathematics and Theoretical Physics, University of Cambridge. There, she is head of the Cambridge Image Analysis group, Director of the Cantab Capital Institute for Mathematics of Information, Co-Director of the EPSRC Centre for Mathematical and Statistical Analysis of Multimodal Clinical Imaging, and since 2011 a fellow of Jesus College, Cambridge. Her current research interests focus on variational methods and partial differential equations for image analysis, image processing and inverse imaging problems.