
Spider solitaire (henceforth abbreviated as Spider) is a popular card game often played on computers online or offline. As the name implies, the game is for one player only. There are two standard decks of cards and the player aims to organise cards into eight complete suits and remove them from the tableau. Cards can be dealt from the stock or moved from one column to another according to certain rules. We won't discuss these rules in detail and assume the reader already understands them. If you need a reminder, see here. In this article we will only discuss the four-suit version of the game.
Spider solitaire is played with two standard decks of cards.
Users have been known to complain about various software programs being biased. More specifically, if a program detects the player has a high win rate, then it will "rig the cards" on subsequent games to artificially reduce the win rate. Of course users can also be on tilt and play below their best. However, with some elementary statistical techniques, it should be possible to validate or refute claims of bias. This can also serve as a good exercise of how one can use data observed in the real world and statistical techniques to test whether an hypothesis (e.g. "a Spider program is biased") is likely to be true or not.
Some basics
For purposes of this article we will assume the player is playing with no "undo", "restart", or "mulligans" (declining a game with a poor initial deal), and that he or she is playing to win without regard to score, time taken or number of moves. Popular belief suggests that very few games can be won under these conditions, but Steve Brown (California State University, Long Beach) gives some detailed strategies in his excellent book Spider solitaire winning strategies and reports a win rate of 48.7% over 306 games. He also points out his play is not perfect and an expert player could do even better, perhaps with a win rate in excess of 60%. By experimenting with Brown's strategies, I am indeed able to achieve a win rate in excess of 48.7%.
Ideally, a Spider program should simulate a game played manually using physical playing cards and assuming perfect shuffling. If at any point in the game there are $N$ cards unseen, each card should have a $1/N$ chance of appearing as the next card turned over (for sake of argument we will ignore the equivalence of cards with identical suit and rank). For instance, we know that there are 10 cards exposed in the starting position. Since there are $8$ kings in a total of $104$ cards, the chance of a single one of the exposed cards being a king is $8/104=1/13.$ The expected number of exposed kings is therefore $10 \times 1/13 = 10/13.$ If after a large number of games we find the number of kings exposed is closer to $11/13$ on average then we will have reason to believe the program is biased.Test statistics
For each game played we wish to record a set of statistics that reflect the luck of the cards, so higher values indicate more chances of winning. The idea is to estimate what value these test statistics would take in a perfectly fair, unbiased game and then compare them to the values recorded in a game we suspect might be biased.
A typical scatterplot is shown (the AGT and ATSV statistics are defined below) where blue circles and red crosses indicate wins and losses respectively.
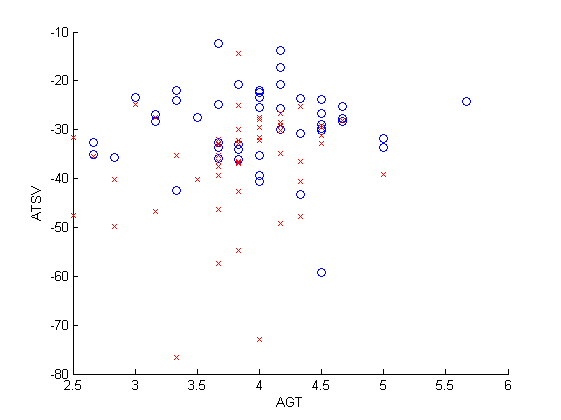
Typical scatterplot for Spider solitaire (o = win, x = loss).
Once the first ten cards are dealt we can calculate the guaranteed turns (GT), that is the minimum number of cards a player can be sure of exposing before being forced to deal another row. We can do a similar calculation whenever a new row of ten cards is dealt (and pretending it is the start of a new game). In this way we can calculate the average GT (AGT). If the GT is low for a number of rounds, the player may get into trouble. Note that the AGT is independent of the player so it is easy to simulate the probability distribution of the AGT by running a large number of trials (that is, dealing a large number of rows).
From my experience, I noted that a player can also get into trouble if the overall distribution of cards is poor. For instance if there are seven Queens but only two Jacks in play problems can occur even with one or more empty columns. Hence I defined the total square variation (TSV), obtained by taking the negative sum of squares of the count of adjacent ranks. In the above example, seven Queens and two Jacks would contribute $-(7-2)^2 = -25$ to the sum. The reason for taking the negative is to ensure that higher values indicate more chances of winning just like the AGT. If we compute the TSV whenever a new card is exposed we can calculate the average TSV (ATSV) statistic for a single game. Note that for the ATSV to be independent of the player, we assume that a player who concedes a game must expose all unseen cards in a random order (although the player can choose which unseen card to expose first, he cannot avoid the fact each unseen card occurs with equal probability). Fortunately this is easily done via simulation.
Simulations revealed that for an unbiased program the AGT should be equal to 3.96 and the ATSV to -32.29 over a large number of games. In the example start position, we would have a GT of 2 and a TSV of -28. We would not know the AGT and ATSV until the game is complete.
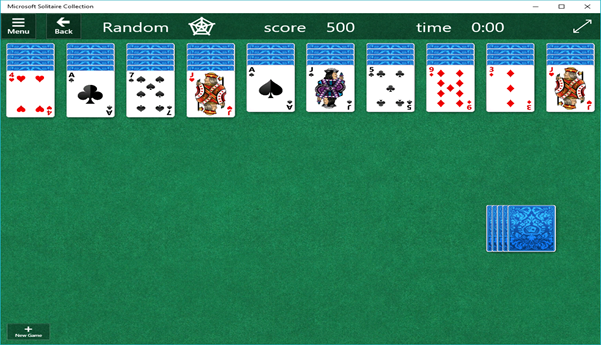
Example start position with GT = 2, ATSV = -28.
Hypothesis testing
To test if a Spider program is biased, we use something called hypothesis testing. We first formulate a null hypothesis. This assumes that the effect we are suspecting might exist isn't actually there — in our case it means that the Spider program is unbiased. The alternative hypothesis states the Spider program is deliberately skewed to reduce the players win rate.
We start by playing a large number $N$ of games of Spider using a program we suspect might be biased and compute the AGT and ATSV for each game. The general idea is to now work out the probability, called a $p$-value, of observing the results we have observed, or something more extreme, assuming that the null hypothesis is true, that is, assuming that the program is not biased. If this probability is below a certain threshold, called the \emph{significance level}, so it's unlikely an unbiased program produces the values of AGT and ATSV we have observed in our $N$ games, we reject the null hypothesis and conclude that the program is biased.How do we calculate the $p$-value, that is, the probability of observing the AGT and ATSV we have observed, assuming the game is not biased? Our simulations have already shown us the expected values of the AGT and ATSV in an unbiased game: they are 3.96 and -32.29 respectively. Rather amazingly, probability theory also tells us how the values of the AGT and ATSV are distributed in an unbiased game. In other words, it helps us measure the probability of observing a particular value for the AGT and the ATSV. A so-called Student's $t$-test puts all this into practice and spits out our $p$-value. We won't go into the details of this here, but you can read up on it on Wikipedia or in any introductory probability and statistics text.
For the purposes of this article we chose $N=100$ for the number of games played using a program we thought might be biased and a significance level of $0.05$.
Estimation of win percentage
Apart from the AGT and ATSV we also wish to estimate the "correct" winning percentage for an unbiased Spider program. One obvious difficulty is that the win percentage is player-dependent, so it is hard to verify a claim that someone can win e.g. 50% of games. Another issue was that I obtained different win rates on various Spider programs, ranging from 45% to above 60% and I had no evidence that my play had improved during the usage of such programs (i.e. my win rate was not positively correlated with increasing time).
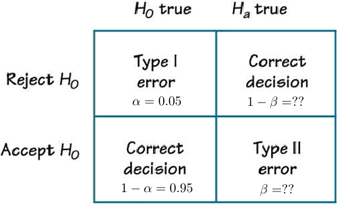
Rejecting the null hypothesis although it is true is called a type I error. The possibility of it occurring is equal to the significance level. The other type of error in hypothesis testing, a type II error, is accepting the null hypothesis even if it is false.
Of particular interest is Pipkin's Idiot's Delight Solitaire Server. This is a free online Solitaire program that features a number of Solitaire variants including the well-known Klondike, Freecell and Scorpion among others. Idiot's Delight allows the player the option of specifying a given seed number from 1 to 999999 For instance, if the seed 142857 were chosen the first ten cards would always be 2J56J9JQ59 of various suits. Note that if the player randomly generates a long sequence of seed numbers in advance to playing the game, then the program cannot adjust the difficulty level according to the player's win rate. For this reason, I used Idiot's Delight to estimate my win percentage.
I played 100 games on Idiot's Delight, using the seed numbers between 1 and 100. I won 59 games and lost 41, so I estimate my winning percentage for an unbiased Spider program to be 59%.
Estimations
I played 100 games of Spider on Free Spider Solitaire. This was chosen since after some experimentation it "seems to be consistently bad": winning is possible but usually requires some effort even for an expert player. For each game I recorded the result (win/loss) and AGT and ATSV statistics. I obtained a $p$-value of $0.115$ and $0.201$ for the AGT and ATSV respectively. This means the AGT and ATSV statistics were less than expected (i.e. bad for the player), but because both values are above our threshold of $0.05$ they weren't statistically significant: it is reasonably possible the low values were caused by chance variation. Unfortunately I won only 46 games, thirteen less than expected. This might suggest further testing is justified; however recall that the win rate is player-specific and it is quite possible I did not play optimally over the course of 100 games.
I conclude there is not enough evidence to prove Free Spider Solitaire is biased. Forty-six wins is a bit disappointing however, methinks the program dodged a bullet. However other Spider programs may not be so lucky...
About the author
Trevor Tao has a PhD in applied mathematics. He is a research scientist currently working for the Department of Defence. Trevor is a keen chess and scrabble player and his other hobbies include mathematics and music. Trevor is the brother of world-renowned mathematician Terence Tao.