Outer space: Another Christmas Carol
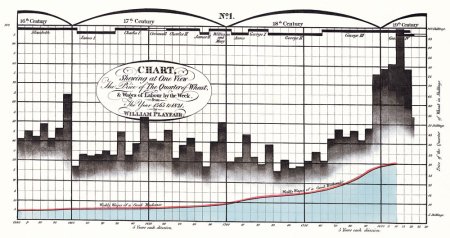
William Playfair's graph comparing the price of wheat (black histogram) and labour wages (red curve) from 1565 to 1821.
"I have endeavoured in this Ghostly little book, to raise the Ghost of an Idea, which shall not put my readers out of humour with themselves, with each other, with the season, or with me. May it haunt their houses pleasantly, and no one wish to lay it." During the next month many of us will hear or watch again a version of Charles Dickens' beautifully constructed Christmas fable, A Christmas Carol, which he first introduced to his readers with these words in December 1843.
Few realise that Dickens had an uneasy relationship with mathematics. He lived at a time when the subject of statistics was emerging as a significant influence in Victorian social and political life. Pioneers like Adolphe Quetelet, in Belgium, were creating the first quantitative social sciences of criminology and human behaviour — a "social physics" as Quetelet called it — whilst his disciples like Florence Nightingale used statistics to hone patient care in hospitals, and devise new ways to present data. William Playfair revolutionised economics and politics by creating so many of the graphs and bar charts that are now standard formats for presenting information and searching for correlations between different social and economic trends.

Thomas Gradgrind from Dickens' Hard Times, apprehending his children Louisa and Tom at the circus. This engraving by Harry French appeared in the British Household Edition.
Dickens, and many other important political reformers regarded statistics with deep suspicion. Indeed, Dickens himself regarded it as a great evil. This sounds strange to modern ears. Why did he think like that? He objected to measures that decided the health of society on the basis of averages. Quetelet's famous concept of "the average man" was an especial bête noire because governments were able to use it to say that people were better off now (on the average) even though the poor were poorer than ever and their workplaces increasingly hazardous. Low-paid jobs could be cut on the grounds that average productivity needed to be higher. Individuals were lost in the tails of the bell curve. Dickens thought that politicians used statistics to block progressive social legislation: they regarded individual misery and criminal behaviour as statistically determined and unavoidable.
Several of Dickens' great novels touch on this deep antagonism he had for statistics, but one in particular, Hard Times, published in 1854, is fashioned around it. It told the story of Thomas Gradgrind: a man who wanted only facts and figures, a man who stood ready "to measure any parcel of human nature, and tell you exactly what it comes to." Even the pupils in the school class he teaches are reduced to numbers. On the wall of his office hangs a "deadly statistical clock". The story tells how this attitude leads to despair in his own life and that of his daughter Louisa, who is forced to marry not where her love inclines, but where her father judges the "statistics of marriage" unambiguously point her. The end result of his single-minded philosophy was misery for all.
Dickens is a remarkable example of a great novelist energised by a new part of mathematics which he thought was misused. If he were alive today, I'm sure he would be much engaged with statistical league tables and the like. If you hear his Christmas Carol again this year, remember his warning about being misled into thinking that just because the world is described by mathematics, it is nothing but mathematics. The right mathematics has to be applied in the right way.
You can hear John D. Barrow talk about Dickens' mistrust of statistics in the Plus podcast Cosmic imagery, which also exists as an enhanced podcast with images.