
As we have shown on Plus a number of times, cricket fans love their maths. So it should come as no surprise that another cricket/maths story has recently appeared, this time from the University of Reading, linking cricket success with the weather. We only blog about our maths/cricket geekiness, but these guys have research funding!
It's heating up for the 2009 Ashes.
Manoj Joshi from the University of Reading has shown that the El Niño Southern Oscillation (ENSO) phenomenon has a significant effect on the results of the Ashes cricket series between Australia and England when the series is held in Australia. The Australian cricket team is more likely to succeed after El Niño years, while the English cricket team does better following La Niña years (the opposite phase). Their study, Could El Niño Southern Oscillation affect the results of the Ashes series in Australia? was published in the journal Weather.
I didn't quite believe this at first, so I took their data, redid the maths, and it turns out that they are correct! However, the media interpretations of these results are not surprisingly a little over the top. While there is a significant correlation between the state of El Niño in the year before the Ashes series and the result of the series, the correlation itself is weak. This is an important point to keep in mind with any correlation — strength and significance are two different things.
Strength refers to how well the data sets move with each other, and significance refers to how likely it is that the correlation occurred by chance. For example, if it rains every time you're trying to have a bbq, then the correlation between your bbqs and rain is strong, but probably not significant, as it's down to pure chance. In our case, however, the correlation is quite weak, but the relationship is significant. The conclusion to this study should be that ENSO plays a very small role in determining the results of Ashes series in Australia, but that other factors are likely to be more important, and that simple noise and randomness will probably have more of an effect than the phase of ENSO. It is only over time that this correlation can be teased out. The study does admit this, with Joshi saying: "There are of course many different factors governing the outcome of any given sporting contest, which would act as noise in this analysis."
But I think his statement that "the study could even influence whether the England touring team should include more fast bowlers or more 'swing' bowlers" is probably a little bold (and to his credit he does admit this).
So, how does this all work?
There are two phases of ENSO — during El Niño, the eastern equatorial Pacific Ocean warms by about 1 degree. For Australia this means low rainfall and high temperatures. La Niña is the reverse, with more rain and a drop in temperature. The study analysed the results of all Ashes matches held in Australia from 1882 to 2007 and found that during El Niño years, the Australian team won 13 out of 17 series (76%), but only five out of the 13 played in La Niña years (38%). England has only won one Ashes series in the last 100 years following an El Niño event — the Bodyline series in 1932/33. The author speculates that cricket pitch conditions can affect the outcome of a match with the drier pitches of El Niño favouring fast Australian bowlers and the English slower swing bowlers enjoying La Niña.
Now to the maths. I have reproduced the results from the paper in figure 1. On the y-axis is the series result (English wins minus Australian wins). On the x-axis is the Niño 3 index, which is a measure of sea surface temperatures in the eastern tropical Pacific. Of course, all the dots should be on integer values of y — some were shifted in the original paper for ease of viewing. The correlation is still correct.
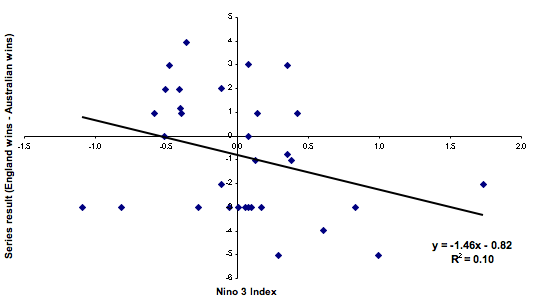
Figure 1: The Ashes results versus the Niño 3 index. A positive value of the Niño 3 index means that the waters are warmer than normal, and a negative value means that they are cooler.
The chart shows the straight line that best fits the data — in this case the line is $y=-1.46x-0.82$. To see how well the line fits the data, you compute the difference between the observed and predicted values, square these differences and sum them. This is related to a quantity called $R^2$. It will range between 0 and 1, with 1 being a perfect fit to the data. It is interpreted as the fraction of the variation in $y$ (series result) explained by $x$ (the Ni\~no 3 index). In this case the $R^2$ value is only 0.1. A value this low is generally accepted as suggesting no correlation at all. The paper itself quotes the value of $R$ (which is equal to -0.31) as opposed to $R^2$, but to determine whether a relationship is strong or not, you need to use $R^2$.

To test for significance, Joshi generated 10,000 sets of random numbers to simulate the Niño 3 index. Each set had 32 members (the same number as the number of Ashes series) which are distributed following the same pattern as the ESNO observations: with a normal distribution with a mean of zero and a standard deviation of 0.8. They then fitted the randomly generated data to the Ashes results of the 32 series and worked out the value of R in each case. They found that R was less than −0.31 in 5% of the cases. In other words, the probability of getting a fit with the value R=−0.31, or better, by pure chance is only 5%, making it 95% certain that the fit found is due to there really being a correlation between the Niño 3 index and the Ashes results. This level is generally accepted as significant.
There is, however, an easier way to do this, using t-tests. The idea is that if there is no correlation, then the quantity R, after suitable manipulation, should follow a Student t-distribution (named after its inventor William Sealy Gosset, whose nom de plume was Student — I thought at school that it was named this because it was used by students, but anyway...). In this case the manipulation involves transforming R into the test statistic t as follows $$t=\frac{R \sqrt{N-2}}{\sqrt{1-R^2}},$$ where $N$ is the number of sample points (in this case 32). With $R=-0.31$ this gives a $t$ value of -1.78. There are tables giving you the probability that such a value of $t$ occurred, given that there is no correlation. In our case (using a one-sided $t$-test) that probability is less than 5\%, confirming the conclusion that the result is significant.
What all this means is that ENSO does have an effect on the Ashes results, but only a very weak one. I wouldn't put any money on either team based on this result! In any case, Australia is going to win...
About the author

Marc West is a freelance science writer and former Assistant Editor of Plus who currently works in operations analysis in Sydney.
As a wannabe Australian cricket player, the stars aligned when Marc somehow scored 114 against Mount Colah in a Sydney shires cricket game. He loves to write about science and sport and has been published in a variety of magazines and newspapers. You can read more of his writing on his personal blog.