


Screening is in place at the Eurostar terminal in London, St. Pancras. Image: Purple.
With five UK airports, as well as the Eurostar Terminal, now screening travellers arriving from high-risk countries for Ebola, the question remains whether this measure is effective. You can think of reasons for and against it, and people have. But the point is that you don't need to rely on speculations to make decisions about preventative measures against diseases. There are ways of measuring their impact that are based on evidence.
A recent study published in the British Medical Journal found that "an entrance screening policy will have no meaningful effect on the risk of importing Ebola into the UK" (assuming that people who are already obviously sick aren't allowed to board a plane). And since the effort is expensive and disruptive, the authors suggest the money would be better spent in West Africa, where it could prevent a humanitarian crisis of "frightening proportions".
Their argument is straight-forward. "For Ebola the incubation period is very long," explains Adam Kucharski of the London School of Hygiene and Tropical Medicine, a colleague of the authors of the study. "If someone gets on a plane without symptoms, they would have to become symptomatic on that flight. The study showed that because the average time between exposure to the virus and becoming symptomatic is around a week, your chances of catching people using those screening methods are incredibly low (around 7%). Introducing those screening measures was very much a political, rather than a scientific, decision."
A little maths...
Crucially, the study's results are based on simple but careful calculations. It's surprising how far some basic maths can get you, and also what you can miss if you're not careful. Early on in the Ebola outbreak people believed that the death rate among infected people was around 50%. The figure was calculated by dividing the total number of deaths by the total number of reported cases. Sounds reasonable, except that among the reported cases were people who were still ill and for whom the outcome, death or recovery, was not yet clear. These people were counted as alive, even though some of them would go on to die, which led to an underestimate of the real death rate.
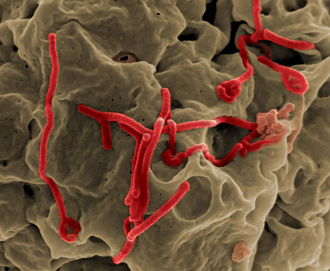
Electron micrograph of Ebola virus budding from the surface of a cell. Image: NIAID.
.jpg)
"This mistake happened a lot and [the 50% figure] was widely reported," says Kucharski. "In a very simple analysis, my colleagues and I tried to adjust the estimate. We know from past outbreaks that the average time between someone having symptoms to recovery or death is around eight days. So we adjusted the data and found the death rate is probably more around 70%, which subsequent clinical studies have lined up with."
At the start of an epidemic, a lot of effort goes into estimating basic figures, such as the mortality ratio among infected people. One hugely important number is the basic reproduction number (usually denoted by R0). It measures how many people an infectious person goes on to infect, on average, assuming that no one in the population is immune to the disease. For Ebola, the basic reproduction number at the start of the outbreak was estimated to lie between 1.5 and 2. This is similar to the number for pandemic flu. Measles, an airborne and highly infectious disease, has an R0 of around 18.
2, 4, 8, 16, ...
Again, some basic maths gives you a rough idea of how quickly a disease might spread. Say you have an R0 of 2 and you know that an infectious person passes the disease on within a fortnight of getting it (which is a realistic estimate for Ebola). Then in one fortnight an infected person goes on to infect two others, who together go on to infect four others the following fortnight and so on:
1 → 2 → 4 → 8 → 16 → 32 → 64 .... → 2n → ...
This is exponential growth which explodes rapidly. After just twenty weeks the disease will have infected
1 + 2 + 4 + 8 + ... + 210 = 2,047 people.
This back-of-the-envelope prediction is crude, of course. Epidemiologists use more sophisticated models to predict the spread of diseases (see The mathematics of diseases and Keeping track of immunity). But it does illustrate just how important the basic reproduction number is. The same calculation for an R0 of 18, as in measles, has the entire world population infected within just sixteen days. Differences quickly snowball in exponential growth, and although our model is over-simplified, exponential growth is often seen at the start of epidemics.
Veering from the average
Once you have estimated the value of R0 for a disease other questions soon come up. "R0 is only an average value across the whole population," says Kucharski. "So the next question to understand is how that varies in the population. For example, it could be that people transmit differently depending on how ill they are." A study published last month suggested that people become more infectious in later stages of their infection. The authors used a mathematical model to show that targetting this period of infection — getting people into isolation when they are at their most infectious or subsequently being prepared for funeral — could have a larger effect than targetting them earlier on. "Adding more detail to the very simple average values is important," says Kucharski.

Barack Obama greets Nina Pham, a Dallas nurse diagnosed with Ebola after caring for an infected patient in Texas, in the Oval Office, October 24, 2014. Pham is now virus-free.
In a similar vein, Kucharski and his colleagues analysed the data of the first ever Ebola outbreak, in Zaire in 1976. "Early on in the current outbreak there wasn't much information on the dynamics of the disease, so we wanted to go back and see what happened in the past." The 1976 outbreak was centred on a hospital which was so strapped for resources, it could only issue five syringes a day, to be shared between people, so the infection spread rapidly. When the hospital was finally closed the epidemic was brought under control, so people naturally assumed that the hospital transmissions were the main culprit. By estimating different values for R0 for people in the community and people in the hospital (both estimated from the data) Kucharski and his colleagues showed that this wasn't the case. "The level of transmission between people in the community was actually quite high. Even if the hospital had been closed much earlier, there could have been a much larger outbreak just by chance."
Chance and uncertainty
Chance is if course a major player, especially at the beginning of an outbreak. The first person to fall sick in Sierra Leone happened to be a traditional healer, whose funeral attracted a large crowd of people who touched the infectious body and then took the disease with them as they travelled to other places. Nigeria, on the other hand, got away with a death toll of eight and the epidemic officially declared over, despite a hospital doctor becoming infected (after a sequence of events that saw two people breaking their quarantine). It was through luck the disease wasn't passed on to the doctor's other patients.
"In those situations where there are very small numbers, all it takes is one event and you could have a very different outbreak," says Kucharski. All we can do here is estimate probabilities, and again, the basic reproduction number is an important measure. A reasonably straightforward calculation (see this article) shows that the chance that a disease with basic reproduction number R0 will turn into a large epidemic is 1-1/R0. With a basic reproduction number between 1.5 and 2, for Ebola that chance works out at between 1/3 and 1/2, that is, between 33% and 50% — we've been unlucky.
There are other sources of uncertainty too when it comes to predicting the course of a disease or the impact of interventions. You might have missed something in your model, or an initial uncertainty in an important parameter, such as R0, might grow as your model simulates events into the future. That latter phenomenon is known as the butterfly effect, and is the reason why many phenomena, such as the weather or the stock market, are so hard to predict.
How can we deal with such uncertainty? "I think that modellers sometimes need to be humble and say that they can't forecast this far into the future," says Kucharski. "People like to have a definite number; journalists especially are keen to report them. But sometimes as a modeller you just have to say that you can't predict with any degree of certainty what these numbers are going to be in four or five months' time." For short term forecasts it's important that researchers quantify and report the uncertainty, and that's what they usually do. There are mathematical tools to pin down just how uncertain you are about a result (such as confidence intervals — see here to find out more). "As with any kind of forecasting, publishing just a single number is a dangerous thing to do."
Sometimes the results of a study are pretty convincing even when there's uncertainty around. The study into the effectiveness of airport screening, once uncertainty is taken into account, says that it's very unlikely that, even at the most optimistic end of the scale, more than at most 13% of infected people would be identified. Even if you catch this high-end figure of 13%, it's still very dubious if the measure is justified. Other measures, such as forced quarantine of returning health care workers may even be counter-productive, discouraging potential volunteers from helping, as no one wants to be detained unnecessarily. We are all prone to knee-jerk reactions when we are frightened, but politicians and the public would do well to heed the predictions of carefully calibrated, evidence-based mathematical models.
About this article
Adam Kucharski is a Research Fellow at the London School of Hygiene and Tropical Medicine. Marianne Freiberger, Editor of Plus, interviewed him in November 2014.