

If you live in Los Angeles there are two things you might feel particularly worried about: earthquakes and crime. It's nice to know, then, that mathematics can help to keep you safe from both. A software system called PredPol, that has been developed by the mathematician George Mohler, the anthropologist Jeff Brantingham, and others, is now being rolled out across multiple jurisdictions of the Los Angeles Police Department and in other cities too. Officers on the ground use it every day.
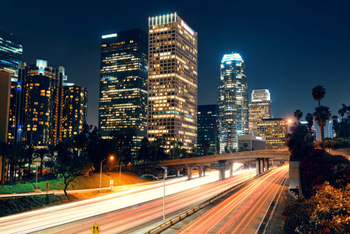
Los Angeles.
PredPol stands for "predictive policing". It works by calculating the probability that crimes will be committed in a particular area on a particular day, based on real-time data from the previous couple of days. Police officers are then given prediction maps telling them where the probability is high, so they can put in place extra patrols and hopefully prevent at least some of those crimes from happening.
So how do you go about understanding crime mathematically? One approach is to look at the situation "bottom-up": simulate the behaviour of individual criminals using mathematical rules and see what kind of patterns emerge (see this article to find out more). But you can also use more of a "top-down" approach: forget about individuals and look at crimes as statistical occurrences, like earthquakes, that exhibit some regularities. PredPol makes use of the latter approach.
Gangs and violence
To get a feel for how this works, let's concentrate on something that's rife in LA and other big cities too: gang crime. Fierce battles over territory are central to gang violence, and whatever one gang does to another, retaliation is sure to follow. That latter point is what makes gang violence similar to earthquakes: acts of violence come with follow-ups, just as earthquakes come with aftershocks.
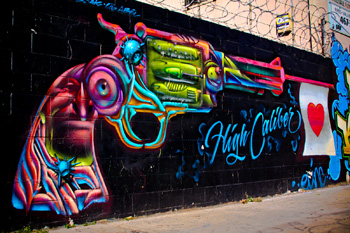
Graffiti in LA. Image: Todd Shaffer.
In a lovely paper from 2010 a group of undergraduates from University of Angeles, California, used such a Hawkes process to model the rivalry between pairs of gangs in the LA policing district of Hollenbeck, which, despite being only 15 square miles in area, is one of LA's most violent regions. The formula they used for the rate function is
$$r(t) = b + k\left( we^{-w(t-t_1)} + we^{-w(t-t_2)} + we^{-w(t-t_3)} + ... + we^{-w(t-t_n)}\right).$$ Here $b$ is a positive constant measuring the background rate of crimes between the two gangs. The $t_1$, $t_2$ up to $t_n$ represent all the crimes that happened in the past before time $t,$ and the terms $we^{-w(t-t_i)}$ reflect by how much the desire to retaliate against these crimes drives up the rate function. You can see that the longer ago a crime happened (the bigger $t-t_i$), the smaller the term $we^{-w(t-t_i)}.$ The $w$ in this expression is a positive constant representing the rate at which the effect of a crime diminishes: the larger $w,$ the smaller the contribution of the term $we^{-w(t-t_i)}$. The number $k$ is a positive factor reflecting the strength of retaliation between the pair of gangs. If two gangs are not too bothered about each other, then $k$ will be small, making the overall contribution of past crimes small too. If their rivalry is really fierce, however, then $k$ will be larger.Models and reality
To use such a model, you obviously need to know which numbers to slot in for the various parameters, such as the background rate. To do this, the students looked at real crime data from the area, provided by the Los Angeles Police Department. There's a statistical method called maximum likelihood estimation (see here for a nice introduction), which allows you to find the parameter values that best fit reality.

Using maths to fight crime.
This is just a simple example of the kind of mathematics a system like PredPol might use — but it gives you a glimpse of the general idea. PredPol is not just used to understand gang violence but other crimes too. The results so far have been encouraging. After the Santa Cruz Police Department started using PredPol in 2011, burglary reduced by 27% compared to the previous year. And in a 2011-2012 rollout in the Los Angeles Foothill Division, crime declined by 12% compared to a 0.4% average increase across the rest of the city. So even though some citizens of LA feel that crime does pay, using maths to fight it does too.
About this article
This article was inspired by the Rouse Ball Lecture, which was given in April 2015 in Cambridge by the mathematician Andrea Bertozzi, who has contributed to the development of PredPol.