
"Lies, damned lies, and statistics" — considering the deluge of data the modern world is showering us with, this famous quote by Benjamin Disraeli seems all the more relevant. Science, as well as policy making, rely on statistical analyses of this data wealth, which makes them vulnerable to statistical mischief. Voices criticising some standard statistical practices have become louder over recent years, so last month the American Statistical Association (ASA) decided to take a stand. In an unusual move the ASA issued guidelines on how to use a particular statistical tool.
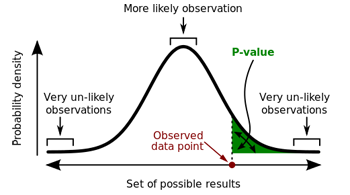
The curve represents the probability of observing particular data points (the x-axis represents the possible data points and the y-axis the probabilities). The tails of the curve represent very unlikely observations. The area shaded in green is the probability of observing a value equal to, or more extreme than, the data point marked in red. Image: Repapetilto and Chen-Pan Liao, CC BY-SA 3.0.
The ASA's bone of contention is something called the p-value. To get an idea of what this is, consider an example: imagine a medical researcher who has tested a particular drug (say to lower blood pressure) in a clinical trial. The result is looking good and appears to indicate that the drug has worked (eg the patients' blood pressure has gone down on average). But of course it's possible that the observations were just a fluke: the patients may have got better by chance, or because of some other unknown factor. However, making some theoretical assumptions, it's possible to calculate the probability of observing the result that has been observed (or something even more pronounced) assuming the drug was not actually effective. That probability is called the p-value. If the p-value is small, so the observations made are unlikely for a non-effective drug, then that lends some support to the idea that the drug does work.
P-values are used all over the place: from medicine to the social sciences, and from particle physics to economics. So what's the problem? If it took you a while to understand what a p-value actually is, then you have a clue to one of the difficulties: p-values are easy to misunderstand or misinterpret. People use p-values to compare a null hypothesis (eg the drug is not effective) to the observations they have made. A small p-value of, say 0.05, means there's only a 5% chance of making the observation if the null hypothesis is true. It's tempting to conclude that, therefore, the null hypothesis only has a 5% chance of being correct, which gives the alternative hypothesis (eg the drug is effective) a 95% chance of being true.
But unfortunately, this kind of reasoning is false. The p-value is not the probability of any hypothesis being true or false, it only measures the compatibility between the null hypothesis and the observations. A small p-value means that the observations aren't very compatible with the null hypothesis, but it doesn't tell you why they are not compatible: it might be down to chance, or to underlying factors you're not aware of. Conversely, a large p-value means your observations are compatible with the null hypothesis, but this doesn't mean the null hypothesis is true: other hypotheses might be equally, or even more, compatible with your data.

Science, policy making and business decisions are based on statistical analyses of data.
The 0.05 figure is another problematic issue. In many sciences, including medicine, it is often used as a magic threshold. If your p-value is less than 0.05, then the null hypothesis is rejected and the complementary hypothesis accepted. But why 0.05 rather than, say, 0.01 or 0.1? That's just the problem. It's an arbitrary convention, so critics say, and represents a "long-worrisome circularity": universities teach the 0.05 figure to their students because the scientific community uses it, and the scientific community uses it because that's what they were taught at university. (Other sciences, notably particle physics, do use different thresholds for their p-values, see here to find out more.)
But regardless of what threshold is used, basing a scientific conclusion, or even a policy decision, on whether a p-value passes such a threshold is itself a crude practice, says the ASA. "A conclusion does not necessarily become 'true' on one side of the divide, and 'false' on the other." The use of p-values as a license to make a scientific claim "leads to a considerable distortion of the scientific process".
Which brings us to the question of context. A p-value by itself only offers one small piece of evidence for or against a hypothesis. Any scientific conclusion needs to be supported by other evidence, and researchers need to be clear about how they conducted their study, how good their measurements were, and what underlying assumptions they used. In particular, researchers shouldn't cherry-pick the results they publish according to whether they come with the right kind of p-value (a practice also known as p-hacking). "Valid scientific conclusions based on p-values and related statistics cannot be drawn without at least knowing how many and which analyses were conducted, and how those analyses (including p-values) were selected for reporting," says the ASA report.
This is a rough summary of the ASA's grievances with the humble p-value (you can read the full report here). At least one scientific journal, Basic and Applied Social Psychology, already banned the use of p-values some time ago, and we will see if the ASA report has any further consequences. But it's worth remembering: it's not the p-value itself that is being criticised, but the fact that it is sometimes used as the primary piece of evidence on which a conclusion is based. As the ASA report says, "No single index should substitute for scientific reasoning."