

This article is based on one of Budd's Gresham College lectures. Watch the full lecture here, and see here to find out more about this free, public lecture series.
A universal constant amongst all animals is the need to eat. The food and drink industry is the largest in the world and in order to feed the growing population of the world we will have to grow more food in the next fifty years than we have in the last 10,000 years.
What does maths have to do with this? The simple answer is "a lot". In this article we'll look at some applications of maths to food, from its role in growing food to its role in transporting and storing food.
It all starts in a field
Most of our food production, whether it is crops or animals, involves a field on a farm. This may appear to be a low technology area, but a lot of science and mathematics is involved in making a field effective for food production. Indeed there are sophisticated computer packages which are used to simulate the behaviour of a field and to advise farmers on the best way to manage the fields on their farm. The basic questions that need to be addressed by a farmer growing crops are: what crops to grow and how much, how much to irrigate them, what pesticides to use, how to react to the weather and when to harvest.
The first of these questions involves the mathematics of optimisation. It is useful to give an idea of how this might work with a simple field (or maybe several fields) on a farm. Let's consider the example of a farm somewhere in the tropics in which we want to grow two crops, such as cocoa and pineapples. If $x$ is the amount of cocoa we plan to grow in one year, and $y$ is the amount of pineapples, the unit cost of cocoa seed is $a$, and of pineapple seed is $b$, then the total cost $C$ of growing the two crops is given by
\begin{equation}C = ax+by+d,\end{equation} where $d$ is the upfront cost we must take on just to use the field in the first place (such as labour, irrigation, pesticides etc). Similarly, when we harvest the crops we might expect a unit return of $e$ on the cocoa, and of $f$ on the pineapples. Thus we might make a profit $P$ given by \begin{equation}P=ex+fy.\end{equation} Finally, if the amount of space taken up by a unit cocoa is $g$ and by a unit pineapple is $h$ then the total amount of space $S$ taken up in the field by our two crops is given by \begin{equation} S = g x + h y. \end{equation} The problem faced by our farmer is then as follows. They want to grow the right amount of cocoa $x$ and pineapples $y$ which in turn maximises their profit $P$. But at the same time they must also want to keep the cost $C$ below some maximum $C_{max}$, (their total available cash) and require that the space taken up is less than the total area of the field given by $S_{max}$. These two conditions are called \emph{constraints}. In mathematical terms the problem of maximising the profit becomes: \emph{Maximise $P$ over all positive values of $x$ and $y$ subject to $CThis problem is a special example of a constrained optimisation problem called a \emph{linear programming problem}. The problem can be solved using a graph. We show an example in which the optimal combination of $x$ and $y$ is highlighted. The horizontal axis represents $x$ and the vertical axis represents $y$. The shaded area is bounded by the lines defined by the constraints and contains values of $(x,y)$ that satisfy the constraints. The optimal combination of $x$ and $y$ occurs at the corner point $A$ of the shaded figure. Perhaps you can work out for yourself why this is the case — if not see here to find out more.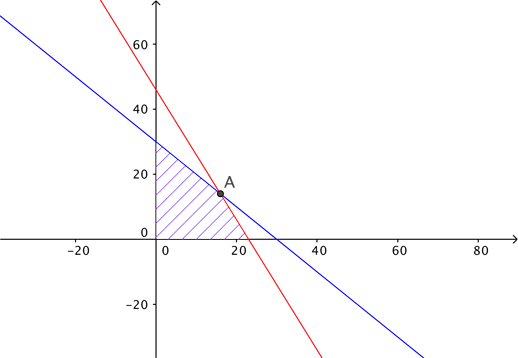
The problem with a=e=g=h=1, b=f=2, and c=4. The optimal combination of x and y occurs at the corner point A of the shaded region.
Generally a farmer will have many more crops, or even animals, to consider, as well as many more constraints, such as labour costs, irrigation costs, and the resistance of each crop to disease and the impact of the weather. This leads to more complex problems similar in form to the one above, but involving many more variables and constraints. A key feature of our problem is that it is linear: we see $x$ and $y$ and their multiples in it, but not more complicated functions such as $x^2$, $x^3$ or $x\times y$. Remarkably, despite their apparent complexity, there is an algorithm to solve all such linear problems. It is called the simplex algorithm, and its invention in 1947 by George Dantzig was one of the key developments in mathematical algorithms in the 20th century. Today countless optimisation problems are solved by the simplex algorithm, from problems in farming to some of the most complex problems in economics and scheduling.
Feeding the world
How much food do we need to feed the world?
Mathematicians have also considered the growth of crops for the whole of the world. This is important if we are to grow enough to feed the whole of the world's population. The problem of how things grow was studied in a classic text by D'Arcy Thompson. If a relatively small amount c of a crop is planted and allowed to grow year on year (during which it will be pollinated), then the rate of growth of the crop is proportional to the amount of the crop. We can express this as a differential equation of the form
$$\frac{dc}{dt} = a(t)c.$$ The derivative $\frac{dc}{dt}$ of the crop $c$ with respect to time $t$ measures the rate of change of $c$ over time, that is, the growth of $c$ over time. The constant $a(t)$ is a \emph{constant of proportionality} which describes just how the growth of $c$ depends on $c$. It will depend upon factors such as the weather and the effects of irrigation and of pests.This equation works well if $c$ is small, but as it gets larger, more resources are needed to grow the crop, and its rate of growth slows down. Also, when $c$ is large enough we will want to harvest it at a rate proportional to the amount of the crop. These effects are well captured by the so-called logistic equation introduced by Pierre François Verhulst in 1838:
$$\frac{dc}{dt} = a(t)c(k-c) - b(t)c.$$ Here $k$ is an upper bound for the amount of crops and $b(t)$ is the harvesting rate. This equation can be solved to find the amount $c(t)$ of the crop at time $t$, and can give a very useful prediction of its value if different harvesting strategies are employed.An equation similar to the one above was originally devised by Thomas Robert Malthus to study population growth in human populations. Such is the power of applied mathematics that the logistic equation can be used in many other areas related to the supply of food. One of these is fishing, where now $ c(t)$ gives the numbers of a fish species, and $b(t)$ a strategy for catching the fish. Extra terms need to be added to allow for the movement of fish into and out of the fishing area, but the basic equation remains the same. Models for the populations of fish allow managements of fisheries to determine what level of fishing is possible to ensure that there is a sustainable fish population.
This isn't all
Once food has been produced (or caught) it needs to be delivered to where it can be eaten. This often involves cooling or freezing the food. The equations of thermodynamics, which describe the behaviour of materials when they are being heated or cooled, are hugely important in this context. Using these equations we can potentially save huge amounts of food going to waste, and allow it to be stored and transported safely.
Transporting food to its intended destinations also introduces huge logistical challenges, made worse by the fact that different foods have different shapes, weights and times of delivery. These problems are very hard to solve. A classical example is the travelling salesman problem, which aims to find the optimal route for a salesman to deliver his goods. You can find out more about this problem, and the huge difficulties in solving it, in this Plus article.
Another example is the knapsack problem which tries to find the best way to fit a set of differently shaped objects into a knapsack, with direct application to the problem of fitting food into a freezer lorry or a transport plane (find out more in this Plus article). Only relatively recently have efficient (probabilistic based) algorithms been developed to provide an answer. These algorithms are now making a huge difference to the way that goods are transported all over the world.
Is it fresh?
But how do you know a food is fresh when you receive it in a shop? One of the more interesting problems that I have had to work on was finding out how fresh a fish is. We often think that we can test the freshness of a foodstuff by its smell, but often food only starts to smell when it is far from being fresh. So, with fish, a method for testing it had to be used which did not (only) rely on its smell. The method we came up with was to look at the elasticity of the skin, and the viscosity (stickiness) of the flesh beneath the skin. Both are closely related to the freshness: our own skin becomes less elastic as we grow older. In order to test this method we produced a mechanical probe to test the elasticity of the fish skin. This probe bounced a small needle off the skin, and then monitored its response. By formulating a mathematical equation for the expected motion of the skin, and comparing this with the measurements of the probe, it was possible to deduce both the elasticity and the viscosity of the flesh, and hence the freshness of the fish.
As we've seen, there's plenty of maths involved in delivering food to our plates. But what about the drink in our glasses? That's what we will look at in this article.
About this article
This article is adapted from one of Budd's Gresham College lectures. See here to find out more about this free, public lecture series.

Chris Budd.
Chris Budd OBE is Professor of Applied Mathematics at the University of Bath, Vice President of the Institute of Mathematics and its Applications, Chair of Mathematics for the Royal Institution and an honorary fellow of the British Science Association. He is particularly interested in applying mathematics to the real world and promoting the public understanding of mathematics.
He has co-written the popular mathematics book Mathematics Galore!, published by Oxford University Press, with C. Sangwin, and features in the book 50 Visions of Mathematics ed. Sam Parc.