


Language is life!
Our ability to learn, use, and process language is something that sets us apart from other animals. Language is used for effective communication, but also allows us to express our creativity through literature, poetry, and song. However, our use of language follows strict mathematical principles as well. One of the best known of these is Zipf's law.
Zipf's law in theory
If you count the frequency with which different words are used in written or spoken texts, and you rank them from most frequent to least frequent, you will find that (on average) the most frequent word will occur roughly twice as often as the second-most frequent word, three times as often as the third-most frequent word, and so on. In other words, the frequency $f(r)$ of a word is inversely proportional to its \emph{rank} (place on the list) $r$: $f(r) \propto 1/r.$The American linguist George Zipf described and popularised this phenomenon already more than 70 years ago. He actually used the more general relationship
\begin{equation}f(r) \propto 1/r^{a},\end{equation} arguing that, for word frequencies, the parameter $a$ will be close to $1$.The above equation is an instance of a so-called power law. One of the characteristics of a power law is that if you visualise it in a log-log plot, it follows a linear relationship. A log-log graph plots the logarithms of both sides of an equation against each other. That this results in a linear relationship for a power law can be shown easily by taking the logarithm on both sides of equation (1) and slightly rewriting it.
First, let's write equation (1) as a proper equality: \setcounter{equation}{1} \begin{equation}f(r) = \frac{C}{r^a},\end{equation} where $C$ is some constant. For example, if $C$ is equal to the frequency $f(1)$ of the most frequent word (i.e., the word of rank $r=1$), and $a=1$ (as Zipf argued), then we get the sequence $f(1)=C,$ $f(2)=f(1)/2,$ $f(3)=f(1)/3$, and so on, as described above. Next, we can take the logarithm on both sides of equation (2) and rewrite it as follows: \begin{equation}\log{(f(r))} = \log{(C/r^a)} = \log{(C)} - a\log{(r)}.\end{equation} Remembering that the general equation of a straight line is $y=mx+b$, where $m$ is the slope of the line, we see that the logarithm of the frequency, $\log{(f(r))}$, does indeed follow a linear relationship in terms of the logarithm of the rank, $\log{(r)}$. In this case the slope is $-a$.This phenomenon, as observed in word frequencies, is known as Zipf's law. Interestingly, though, the same phenomenon has also been observed in many other areas. For example, it occurs in areas closely related to language such as music or computer code, but also in completely unrelated systems such as sizes of cities or connections in networks like the internet or the power grid. It even shows up in snooker statistics (see below)! The main difference, though, is that the values for the parameter $a$ in the corresponding power law (i.e., the slope of the linear log-relationship) can be quite different for these different systems. (You can find out more about power laws in these Plus articles.)
Zipf's law in practice
As good citizen scientists, we of course want to verify Zipf's law for ourselves, and perhaps even analyse some of our own favourite texts (see this article for our first venture into the world of citizen science). Luckily this is very easy to do.
To verify the general phenomenon, a list of the 5000 most frequent words (together with their actual frequencies) from the Corpus of Contemporary American English (COCA) can be used. The COCA is a 450-million-word collection of contemporary English texts, spanning many different literature categories and authors.
Taking the 50 most frequent words from this list and plotting their frequencies $f(r)$ against their rank $r$ in a log-log plot results in a graph as shown in figure 1. To check how closely this graph follows a linear relationship, and to estimate the parameter value of the corresponding power law, a linear regression can be performed on the logarithms of these frequencies and ranks. Such a regression finds the straight line that best fits the data. The straight line in figure 1 represents the result, giving a slope of $-0.922$, i.e., a value of $a=0.922$ in the corresponding power law. This is indeed a value close to $1$, as Zipf originally argued. Furthermore, according to the regression statistics, this linear relationship can explain 98\% of the observed frequency distribution (for those who know some statistics, $R^2=0.98$), and is thus an excellent fit.
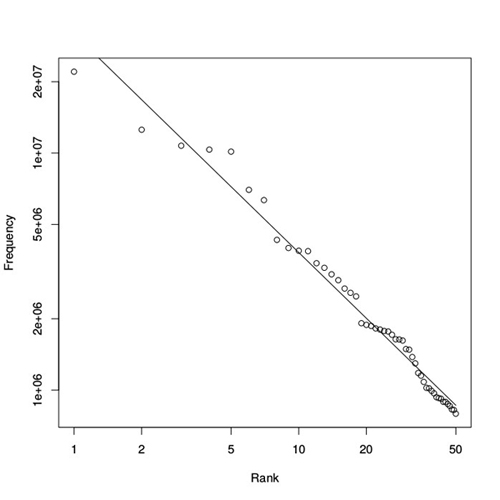
Figure 1: Distribution of word frequencies in the COCA database. The frequencies of words (vertical axis) against their rank (horizontal axis) in a log-log plot for the 50 most frequent words in the Corpus of Contemporary American English (COCA). The straight line represents a linear regression estimate of the corresponding power law, resulting in a parameter value of a=0.922.
To perform the linear regression analysis, the R program was used. This software can be downloaded and installed for free, and runs on all platforms (Windows, MacOS, and Linux). To see the short R script I wrote for the regression analysis and to produce figure 1, click here. You can modify it to analyse your own data.
But how to get frequency data for your own favorite texts, or even for your own writings? For that we can use another free tool, the [ http://1.1o1.in/en/webtools/semantic-depth ] semantic depth analyzer, which includes a nice example of Zipf's law occurring in a large (and also free) database of books. After clicking on the link "This gadget" on that web page, a small app opens up that allows you to paste in any text, for which it will calculate the word frequencies. You can then replace the frequency data in the above-mentioned R script with your own data, and simply re-run the script.
I did this for one of my personal favourite books, The Origin of Species by Charles Darwin. The results are shown in figure 2. The estimated parameter value for the corresponding power law is $a=0.829$, a little less close to $1$ than for the COCA database, but the fit of the straight line is even better: $R^2=0.99.$
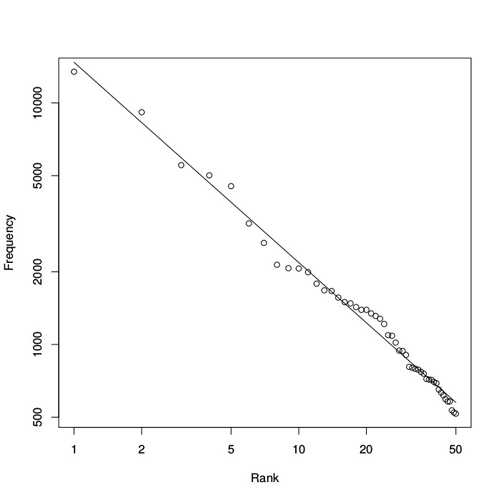
Figure 2: Distribution of word frequencies in The Origin of Species. The estimated parameter value for the corresponding power law is a=0.829.
As this example shows, there can be differences between the "average" word frequency distribution (as represented by the COCA database) and that of an individual book or author, even though both follow a power law. Clearly there are differences in the parameter value of the respective power laws, such as $0.922$ for the COCA database and $0.829$ for The Origin of Species. However, and perhaps more importantly, there are also differences between the actual ranks $r$ of specific words.
For example, the first five words in the COCA ranking are "the", "be", "and", "of", and "a" (in that order). However, the first five words in the ranking of Darwin's book are "the", "of", "and", "in", and "to". The most frequent word ("the") is the same for both, but "of" appears in second place for Darwin instead of fourth for COCA, and "be" (in second place for COCA) does not even appear in Darwin's top five. I will return to these individual differences shortly.
If you are interested in learning more about the intricacies (and sometimes controversies) of word frequencies and Zipf's law, this insightful review paper provides more details. It also presents a nice overview of what has been done so far to try and explain why language does (or even should) follow Zipf's law at all, and what is still missing and left to do for future research.
Zipf's law in snooker
As a fun little exercise, having just watched the world championships snooker, I wondered whether Zipf's law might also show up in snooker statistics. A quick search turned up this ranking list of career centuries. If you are familiar with snooker, you will know that a century break is a score of at least 100 points within one visit to the table (i.e., without missing a shot). The "career centuries ranking" lists all players who have made at least 100 centuries throughout their career (during official play, that is, not including practice or exhibition games). Of course this list is topped by the amazing Ronnie "The Rocket" O'Sullivan with close to 900 career centuries (and counting!).

Ronnie O'Sullivan. Image: DerHexer, CC BY-SA 4.0.
_2015-02-06_08.jpg)
Plotting these statistics in a log-log plot and fitting a power law gives the results as shown in figure 3. As the graph shows, the match is not quite as close as for the word frequencies above, but with $R^2=0.95$ it is still a fairly good fit. Especially for the highest and lowest ranks the discrepancies between the actual data and the fitted power law are somewhat larger, which is often the case with these kinds of statistics. The estimated parameter for the power law is $a=0.594$, which is quite different from that for the word frequencies. But it is interesting, and somewhat surprising, to see that Zipf's law indeed shows up in snooker statistics as well!
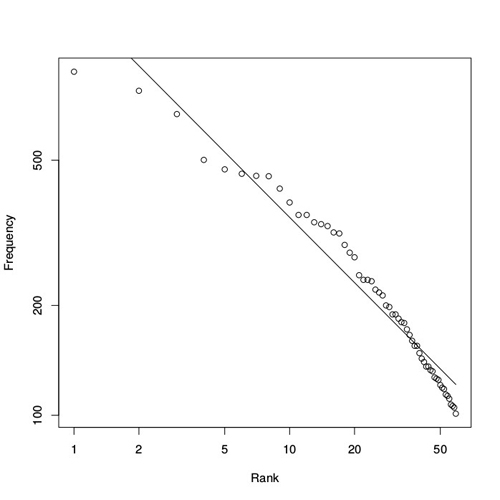
Figure 3: Distribution of career century breaks in snooker. The estimated parameter value for the corresponding power law is a=0.594.
Making your words count
As was already indicated above, there can be differences in actual word frequency distributions between individual pieces of text or authors. This brings up the question of whether the specific frequency distribution of a given text can say something about its author.
Indeed, how authors express their thoughts reveals much about their character, according to psychologist James Pennebaker. In particular, an author's use of so-called function words (such as pronouns, articles, and a few other categories of words that, on their own, convey little meaning) is apparently directly linked to their social and psychological states. Simply put, your choice of words says something about your personality.
Pennebaker and colleagues have developed a sophisticated computer program (unfortunately not free, though) that collects statistics about an author's use of words in specific categories (such as function words). With this software they then analysed thousands of books, blogs, and speeches, and were able to link an author's specific word use to their personality, honesty, social skills, and intentions. This connection had already been discovered earlier, but with this new software tool it has become possible to investigate it in much more detail and on a much larger scale, firmly establishing the link between linguistics and psychology.
The language of statistics is not always easy to understand. But statistical analysis provides a useful and versatile tool. And this mathematical language — as Zipf, Pennebaker, and others have shown — can in turn be used to analyse natural language as well, making your words count by counting your words: the statistics of language.
About the author

Wim Hordijk is a computer scientist currently on a fellowship at the Konrad Lorenz Institute in Klosterneuburg, Austria. He has worked on many research and computing projects all over the world, mostly focusing on questions related to evolution and the origin of life. More information about his research can be found on his website.