
It's been a very strange year for everyone around the world, and for many a very difficult year. And so it's understandable many of us yearn for a brief respite and to see our families and friends again. Many of us in the UK were very pleased to hear of the proposed relaxation of the COVID restrictions for Christmas, when we can choose to form Christmas bubbles with up to two other households, even if just for a few days.

Christmas baubles always need to be handled with care, but this year watching your b(a)ubbles is particularly important.
But what impact might this brief relaxation of the rules mean for the epidemic in the UK? That is the question Ellen Brooks Pollock and Leon Danon, epidemiological modellers from the University of Bristol and the University of Exeter, considered as part of their role in SPI-M, a modelling group which feeds its results into the Scientific Advisory Group for Emergencies (SAGE).
Their work showed that, if everyone pushes these relaxed rules as far as possible, there is a real risk that the epidemic will grow exponentially at a much faster rate. However, it will make a real difference if those who have decided to form Christmas bubbles stick to the rules, and if they also restrict their contact with others before and after the Christmas period. And if those of us who are still undecided choose not to form Christmas bubbles, the virus is far more likely to be kept under control.
Fulfilling your R potential
We are all now familiar with the R number – the average number of people a person with COVID-19 will go on to infect – as one measure for gauging the current state of the epidemic (you can read more about the R number here). If R is greater than 1 the number of infections grows exponentially; if R is kept less that 1 the disease will eventually disappear. Without any restrictions R is about 3 for COVID-19, but we have seen that the R number can be effectively reduced by things like self-isolation for people with symptoms or those who have tested positive and their contacts. The other way to reduce R and restrict the spread of the disease is by reducing everyone's social contacts. The effective value of R depends on having enough contacts to fulfil what you might think of as your R potential, says Brooks Pollock.
See here for all our coverage of the COVID-19 pandemic.
While we usually think of the R number in terms of person-to-person infection, we can also think of it as a household-to-household value: the number of other households that an infected household infects. When R is 3, if you had COVID-19 you might expect to infect one person in your household and two others outside your household. It's very hard to break the contacts within a household, but it's more feasible to break contacts with other households. Breaking links with other households reduces your ability to fulfil your R potential, and so reduces the effective R number. This is exactly what is behind the various levels of COVID restrictions on household mixing.
Phase change
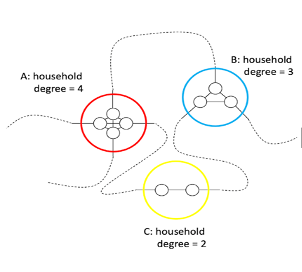
When they were analysing the impact of household bubbles, Brooks Pollock and Danon started with individual households with no bubbling. Each household is a single node representing all of the people in that household: you can see this in the image below with the red, blue and yellow circles each representing households of varying size. The number and size of households followed the results from the most recent census in 2011.
To capture how a disease can move between households the researchers assumed that every person in a household is linked to one other person outside their household in some way, perhaps representing your child sitting next to another child in school, or your interactions with a work colleague. So for every person in a household one link was added to another household randomly chosen from the network.
A small section of a baseline network.
This process of linking households produces what is called a baseline network. Brooks Pollock and Danon found that, whenever they formed a baseline network using this random linking process, around 92% of the households are all connected together, forming one giant component. Any household can be linked by a small number of steps to any other household in this giant component. The presence of such a giant component shows that almost any infected person can easily fulfil their R potential and infect other households, pushing up the effective R number so that the disease can then quickly spread through most of the network.
To model the increasing restrictions on household transmission, Brooks Pollock and Danon then removed a proportion, (1-p), of the links in the baseline network at random. You can think of p as the average number of links per person to outside households. When p=1, you have removed 0 links, and you have the baseline network we've just described (with each person connected on average to one other household). So when p=1 there is a giant connected component containing around 92% of households and the disease is free to run its course through most of the population. When p=0, no one is linked to anyone else outside their household: the network is completely disconnected and the disease is stopped in its tracks.
But a surprising thing happens when you are somewhere between an average of 1 external links per person, and zero external links per person. At a particular critical point, pc=0.48, the network suddenly fragments and the giant component disappears. If the average number of links per person is just a little bit more than pc the giant component remains, just a little bit less than pc and the giant component disappears.
As you decrease p (and increase the proportion (1-p) of links you've randomly removed), the giant component in the resulting network does decrease in size. But it doesn't do this smoothly. Instead, it undergoes a phase transition, similar to the change we see physically when water freezes to ice, or steam condenses to water. This is a key idea in the area of maths called percolation theory. "Percolation theory has served as a direct analogy for infectious disease transmission," says Danon.
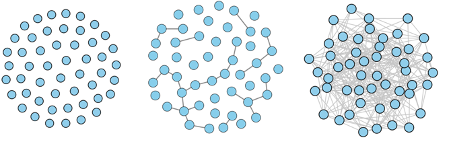
In the left image p=0 and all links have been removed. In the image on the right p=1 and we have the baseline network with a giant component. In the centre image p=pc, where the network undergoes a phase transition, and the giant component appears/disappears. (Image from Kawamoto et. al. 2015 – CC BY 4.0)
The connectivity of the network is on a knife edge and this critical threshold at which the network becomes almost fully connected, called the percolation threshold, is related to our familiar R number. The higher the percolation threshold, the harder it is for a disease to percolate through our network and the lower the effective R number.
Bubbles
Back in May the UK was well into the depths of its first lockdown and there was concern for how hard this was for people living alone. SPI-M modellers, including Brooks Pollock and Danon, explored the impact of households forming bubbles together. They used their household network model to the effect of single households joining together (1+1), or a single household joining to a household of any size (1+n).
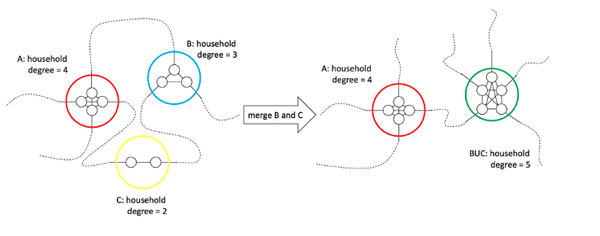
Merging households in the network to create bubbles.
The good news of this work was that single household bubbling doesn't have that much impact on the percolation threshold pc: it decreased a little, from 0.48 for no bubbles to 0.44 for the (1+1)-bubbles, or 0.41 for the (1+n)-bubbles. The subsequent impact on the effective R number by this change to household structures was confirmed independently by a different mathematical analysis by a team from Warwick University. Allowing people living alone to form support bubbles with another household would have only a small impact on the spread of the disease and is unlikely to push the R value over 1, but would have big positive impact in the lives of a lot of people, so the government updated its advice.
Brooks Pollock and Danon have returned to their models in response to the government's plans to relax the rules for Christmas, and allow up to three households to bubble together exclusively for a few days. This change in household structures will definitely impact on the spread of the disease, but by how much?
If everyone did make the most of these relaxations and joined together to make 3-bubbles, then the percolation threshold would dramatically drop to just 0.15. When the percolation threshold is this low, it only takes 1 in 6 people having a link to another household for the giant component to form. In this model the resulting R number would definitely be greater than 1, allowing the disease to spread exponentially through the population.
The impact of bubbles
Fortunately, it's thought that about a quarter of people are not planning to form a Christmas bubble with any other household, and this will reduce the impact of the Christmas bubbles that will be formed. Brooks Pollock and Danon made their Christmas bubble models more realistic by different plausible scenarios. Their worst case scenario is that 75% of households form Christmas bubbles (of two or three households). As you'd expect this gives the lowest percolation threshold and will definitely push the R number above 1, allowing the disease to spread exponentially through the population.
A more reasonable scenario is that half of households form Christmas bubbles. Under this scenario the Christmas plans result in a higher percolation threshold, and a more moderate impact, than the worst-case scenario, but these plans may still push the R number above 1.
And the plausible best case scenario is that only a third of households form Christmas bubbles. The impact of the bubbling in this case is close to that of support bubbles for single households that was allowed earlier in the year. The percolation threshold is higher than for the other two scenarios and we have a better chance of getting through Christmas without pushing R significantly above 1.
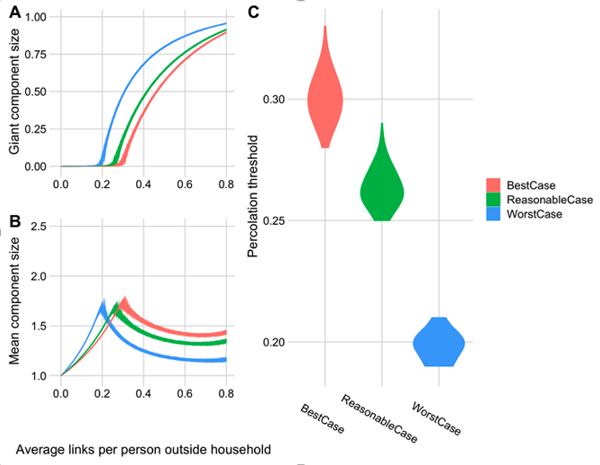
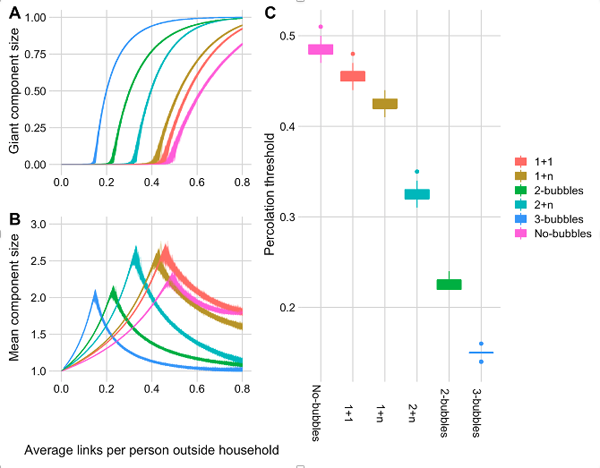
Percolation analysis for plausible bubbling scenarios. A) The proportion of households connected to the giant component. B) The mean component size (order parameter) for the same bubbling strategies. C) The percolation threshold for the different bubbling assumptions.
Making plans for Christmas
Brooks Pollock and Danon are working with a simplified model of how households are connected, but this phenomenon of sudden change from a mostly disconnected network, to one where almost all the network is connected, is observed in such networks of connections. And this sensitivity to how households connect means that any of us can have a great impact on the spread of the disease – we can help keep the connections below that critical percolation threshold.
If you are planning to form a Christmas bubble, then the modelling suggests that keeping within the rules of a maximum of three bubbles will make a real difference to the reach of the disease. The other way to restrict the disease's reach is to reduce your connections before, and after, you form a Christmas bubble. That way you'll reduce your chance of taking out, or bringing in, the disease to a part of the network that might otherwise be disconnected from the reach of the disease.
And if you haven't yet decided whether you will form a Christmas bubble, you deciding not to will have a big impact on the spread of the disease over this period. You, and any other households who decide not to join a Christmas bubble, are making the biggest contribution to keeping yourselves, and the wider community, as safe as possible this Christmas.
About this article
Ellen Brooks Pollock is a senior lecturer at the University of Bristol. She went to university to study medicine, but quickly swapped to maths. She is interested in using maths to describe all things infectious.
Leon Danon is a Senior Lecturer at the University of Exeter who studied Physics at undergraduate and got interested in epidemic modelling during his PhD on complex networks.
 Ellen Brooks Pollock |  Leon Danon |
Marianne Freiberger and Rachel Thomas are Editors of Plus.
This article was produced as part of our collaboration with JUNIPER, the Joint UNIversity Pandemic and Epidemic Response modelling consortium. JUNIPER comprises academics from the universities of Cambridge, Warwick, Bristol, Exeter, Oxford, Manchester, and Lancaster, who are using a range of mathematical and statistical techniques to address pressing question about the control of COVID-19. You can see more content produced with JUNIPER here.
