
What's the safest way of opening schools? Researchers from the JUNIPER Consortium have been exploring this question and have come up with some very interesting results. "We weren't investigating whether we should reopen schools," says Louise Dyson, Associate Professor in Epidemiology at the University of Warwick and a member of the JUNIPER consortium. "Instead we were asking, are there things we can do with testing to make things better."
See here for all our coverage of the COVID-19 pandemic.
Dyson was one of the speakers at the JUNIPER research meeting last week, held virtually by the Isaac Newton Institute (you can see her talk here). At the beginning of 2021 when we thought schools were returning, the government proposed new strategies for COVID-19 testing in secondary schools. "There was a lot of talk about how testing was going to help schools to reopen safely, and we wanted to be really clear about what the benefits and drawbacks were of different sorts of testing," says Dyson. Working with Trystan Leng and other colleagues from the University of Warwick, Dyson has developed a model of the impact of these new testing strategies on secondary school students.

Can testing make reopening schools better for students?
Before Christmas school students attended school as part of a "bubble", usually formed of their year group. If a student tested positive then everyone in their bubble could be sent home to self-isolate for 10 days. This strategy had the advantage that all the potential cases would be self-isolating and wouldn't be able to transmit any infection within the school or wider community, but it had the disadvantage that many students missed a great deal of school.
To reduce the number of days students would miss school a new strategy using lateral flow tests (LF tests) was proposed – serial contact testing. When a case of COVID is identified, the other students in that bubble can either self-isolate as before, or they can take a daily lateral flow test for 7 days and attend school if that day's test was negative. "The main benefit of this strategy isn't that you reduce infection rates, instead it is that more kids get to go to school," says Dyson.
Students would also be asked to take two lateral flow tests before they started school at the beginning of term, starting only if they test negative. Weekly testing of students with lateral flow tests was also being considered.
Sensitive tests
The lateral flow test is similar to the PCR test most of us have had to take at some point during the pandemic: a swab is rubbed on the back of your throat and stuck up your nose to take the sample. But the difference with a lateral flow test is that it is much faster to give results, rather than having to send the swab away to a lab to be analysed, the test kit itself gives you a result in about half an hour.
"What you might have heard about the lateral flow tests is that they are a lot less sensitive than PCR tests, and that is to some extent true," says Dyson. "But it also depends a lot on where you are in your infection." At the point when you are thought to have the highest viral load and be the most infectious, about five days after you are infected, you have a high probability of testing positive for COVID-19 with a lateral flow test. "[The probability you will test positive] is still a little bit lower than the PCR test, but when you are at the peak of your viral load, and therefore, we think, at the peak of your infectiousness, you are more likely to test positive." As you can see in the graphs below, the sensitivity of the lateral flow tests drop away over time, and you are more likely to still test positive on a PCR test later in your infection: "but it's not clear how much that matters, as you are probably not very infectious at that point anyway."
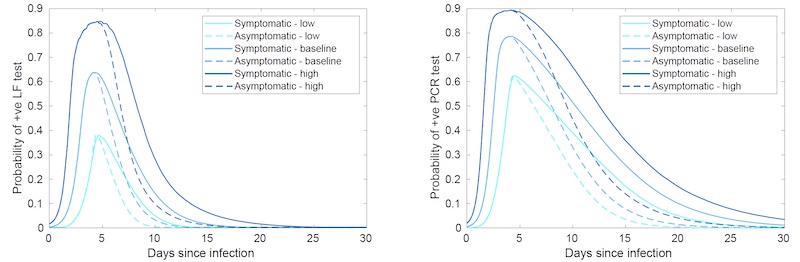
Probability of testing positive for COVID-19 with a lateral flow test (left) and a PCR test (right) over the course of your infection. The different colours indicate different assumptions about the sensitivity of the tests, and the dashed lines indicate the difference for asymptomatic infections opposed to people displaying symptoms. (Image: Louise Dyson)
Dyson and her colleagues wanted to understand the impact that changing strategy from isolation to serial contact testing would have on school students. "The main benefit of this strategy isn't that you reduce infection rates, instead it is that more kids get to go to school. We are moving from this situation where people are just staying at home – they wouldn't be available to transmit infection – to a strategy where, if your test came back negative and it was false negative, that would in fact increase infection rates."
Modelling uncertainty
You'll see different colours used in the graphs of the sensitivity of the lateral flow and PCR tests. This is because researchers aren't able to pin down this sensitivity exactly. Instead the colours indicate the range of uncertainty researchers have for the sensitivity for the tests, from high sensitivity (dark blue) to low sensitivity (light blue).
And this isn't the only uncertainty that disease modellers like Dyson and Leng have to deal with. It was thought that anywhere between 12-31% of secondary school aged children who are infected with COVID-19 develop symptoms. And although we know that symptomatic cases are more infectious than asymptomatic cases, we don't know how much more: it could be anywhere between 30 and 70%.
"Part of the difficulty of making this kind of model is that there is a lot of uncertainty in these kinds of parameters," says Dyson. "And the way we approached that is we tried to incorporate that uncertainty into our model, by taking these ranges rather than point estimates."
Dyson, Leng and their colleagues created a model consisting of five bubbles of 200 students each, who randomly mixed with other students in their year bubble. This roughly models the set up of a secondary school without any sixth form students. They ran the model with daily time steps over a 7 week half term, for each of the following strategies: doing nothing, the pre-christmas strategy of isolating year groups, serial contact testing, weekly mass testing, and a combination of both serial contact testing and mass weekly testing.
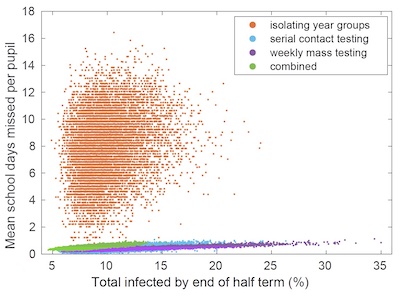
This plot has a point for each parameter combination explored by the modellers, illustrating the range of uncertainty in both the parameters and the results. (Image: Louise Dyson)
And rather than run the models with just a single value for each parameter, they ran them for many different combinations of values, covering the full range of uncertainty for each parameter. The plot on the right has a point for each combination of parameters the modellers used, illustrating the range of uncertainty, not just of the parameters going into the model, but the uncertainty of the results coming out of it.
"We are thinking of this model as a way of comparing different strategies," says Dyson. Rather than making specific predictions of how many people would be infected, or how many school days would be missed, they were interested instead in exploring what would happen if you followed different strategies. And despite the uncertainties involved, it was clear that the strategies would have different outcomes for the students.
Tradeoffs of testing
One thing was very clear from the modelling: despite the uncertainties the use of lateral flow tests in these new strategies would dramatically reduce the amount of school days missed. "The proposed strategies (serial contact testing (ii) and weekly mass testing (iii)) really do reduce the number of school days missed – in some sense they have the desired result," says Dyson. "But they do increase the number of infections."
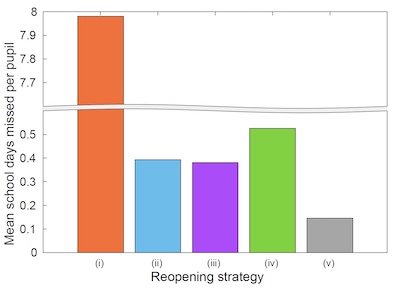
This plot shows the dramatic reduction in school days missed with the proposed strategies using lateral flow tests. The number of school days missed in the pre-Christmas strategy is so much greater that the researchers had to lop off the vertical axis to display the results.
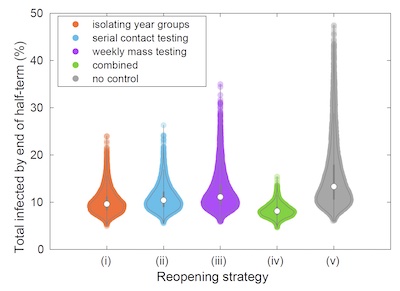
This plot shows the spread of results of the model for the number of infections by the end of the half -term for the different strategies. (Images: Louise Dyson)
If you do not implement any strategy at all (the grey results in the plots) – not even isolating year groups – the number of infections can get very high by the end of the half-term. "The proposed strategies are somewhat effective at reducing infections, but they are less effective than the pre-christmas strategy of isolating whole year groups," says Leng.
But Leng explained that there was one way of reducing both the number of school days missed, and reducing the number of infections: "Combining serial contact testing with weekly mass testing is the most effective strategy we considered at reducing infections."
This combined strategy pays off because all this testing identifies lots of asymptomatic COVID cases. But this is also where the tradeoff comes. "Combination testing looks good, it has less infections and reduces the days missed from school. But you have to do a lot of testing," says Dyson. For the combined strategy, at the end of your 7 week half-term, each student will have taken, on average, 25 tests. That's a lot of tests to buy, and a lot of times to ask young people to take them. "It's not great to have to be sticking things up kids' noses everyday, that's the tradeoff."
This research highlights the difficult decisions that have to be made by government and school leaders during the pandemic. We will wait to see how the testing situation unfolds when schools return next week. On the positive side, the research also shows just how useful mathematical models are when it comes to dealing with the unprecedented challenge of a live pandemic.
About this article

Louise Dyson

Trystan Leng
Louise Dyson is an Associate Professor in Epidemiology at the University of Warwick.
Trystan Leng is a postdoctoral researcher at the University of Warwick.
You can read more about the work they were discussing in this article in their paper.
Rachel Thomas is Editor of Plus.
This article was produced as part of our collaborations with JUNIPER, the Joint UNIversity Pandemic and Epidemic Response modelling consortium, and the Isaac Newton Institute for Mathematical Sciences (INI).
JUNIPER comprises academics from the universities of Cambridge, Warwick, Bristol, Exeter, Oxford, Manchester, and Lancaster, who are using a range of mathematical and statistical techniques to address pressing question about the control of COVID-19. You can see more content produced with JUNIPER here.
The INI is an international research centre and our neighbour here on the University of Cambridge's maths campus. It attracts leading mathematical scientists from all over the world, and is open to all. Visit www.newton.ac.uk to find out more.
