
The UK is yet again bracing itself for a government announcement regarding COVID-19 restrictions. The worry this time surrounds the Delta variant, first detected in India and classed a variant of concern by the UK government on May 6, 2021. This week, a number of researchers from the JUNIPER consortium, whose work feeds into SPI-M and SAGE (the Scientific Advisory Group for Emergencies), published the summary of what they have learnt about the Delta variant to date, and what it potentially means for our near future.
See here for all our coverage of the COVID-19 pandemic.
"Collecting and interpreting data about a new variant as it is first appearing in a population, and modelling its potential impact, is an extremely difficult task," says Julia Gog, a senior member of JUNIPER.
"Our scientists started focussing particularly on the Delta variant in early April and we have spent the last three weeks making sure our results are robust as new data is continually becoming available. We have been developing novel methods in response to immediate needs, but these approaches are now out there and tested, and ready for use against future variant threats."
It was the early work by JUNIPER members, particularly Robert Challen, that first brought the potential of this variant to SPI-M's attention. The early warning helped inform the government's response to the Delta variant back in May, when surge testing and targeted interventions were put into place in emerging hotspots.
The subsequent stress-testing of these first results confirms what was already suspected back then: that the Delta variant is likely to become dominant in the UK. Depending on just how transmissible the variant is and exactly how it responds to the vaccines, this means the possibility of a sizeable third wave is not off the table.
Why is there concern despite the vaccines?
There are various reasons for why we're not yet in safe territory, despite the vaccination programme going well. Since there are still many people who have not been fully vaccinated, and since the vaccines aren't 100% effective against any variant, there is still scope for the virus to outrun the vaccines. The possibility of new variants emerging compounds this threat. The worry here is that a new variant could be more transmissible than existing ones, or more resistant to the vaccines.
Although there's a lot of uncertainty surrounding many aspects of COVID-19, it is possible to construct mathematical models that allow you to explore scenarios that are likely to occur under various assumptions about the new variants. Such modelling work was already done by JUNIPER researchers in the middle of May, and first presented at a research meeting hosted by the Isaac Newton Institute (INI) in May.
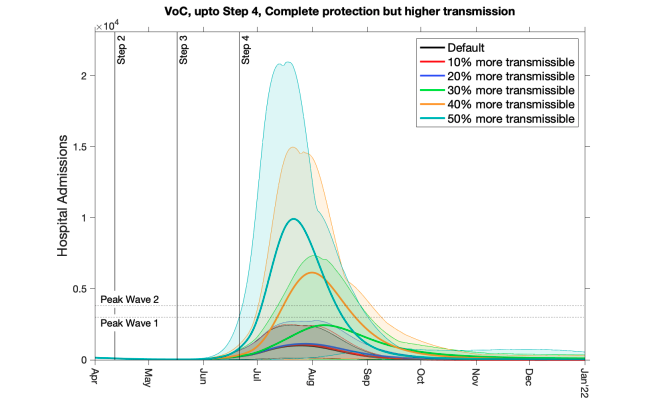
Projected hospital admissions for a novel variant with higher transmission rates. Figure from Road Map Scenarios and Sensitivity: Steps 3 and 4 by Ed Hill and colleagues, published 5 May 2021.
The plot above shows the result of such modelling by Ed Hill a postdoctoral researcher and his JUNIPER colleagues at the Zeeman Institute at the University of Warwick. The figure shows projected hospital admissions for COVID-19 for the scenario of a new variant that is potentially more transmissible than the previously dominant Alpha variant, the variant first detected in Kent in the UK.
Different colours represent different assumptions of the transmissibility of the new variant: from 10% more transmissible to 50% more transmissible. The model assumes the vaccines offer the same protection against infection and severe disease as they do against the Alpha variant, and that their roll-out will continue as planned. It also assumes a that restrictions are eased in line with the government's Roadmap at the earliest possible date. The horizontal axis measures time and the vertical axis measures the estimated number of hospital admissions. The height of the first and second peaks of the pandemic are indicated by the horizontal lines and the dates of step 2, step 3 and step 4 of the Roadmap by vertical lines.
The plot clearly illustrates why scientists take any new variant seriously, including the Delta variant, says Hill. "Even though vaccines can be protective against severe infections, the number of infections and hospitalisations could still be high for a variant of concern that has certain properties." (You can find out more about the model used by Hill and his colleagues, about the underlying assumptions and what its results mean for the Roadmap in this paper from May 2021.)
How can we observe Delta?
Scientists can't yet say exactly how transmissible the Delta variant is compared to the original wild type that started the pandemic, or the Alpha variant which has recently dominated UK infections. Gleaning information from a live pandemic that is constantly changing in front of our eyes is tricky, and more data is needed before we can make reliable calls on things like transmissibility.
However, careful detective work by JUNIPER members gives insight into how wide-spread the Delta variant is in the UK. A type of PCR test called a TaqPath test which, as well as testing for COVID-19, can detect the presence of a mutation that is linked to different variants.
Samples that test positive for the so-called S gene indicate that the person who gave the sample either had the original variant, or one of the other variants known as Beta (first detected in South Africa), Gamma (first detected in Brazil) and the Delta variant. Samples that test negative for the S gene in this period are nearly all from people who have the Alpha variant.
"It was our experience with observing the growth of the Alpha variant through S-gene positive status in late 2020 that alerted us to the fact that something worrying was happening early on," says Leon Danon, a member of JUNIPER. "Genetic sequencing data have a delay of up to three weeks, whereas the S-gene positivity status is as short as 2-3 days which allowed us to raise the alarm much faster."
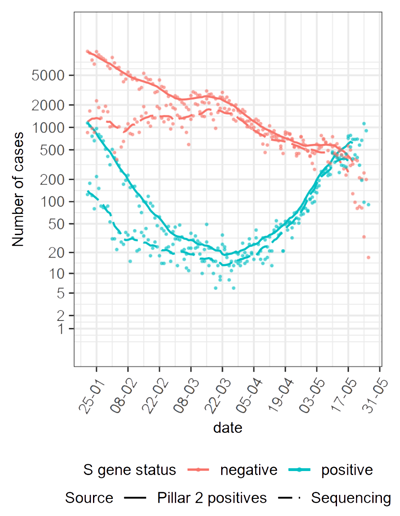
The number S positive (blue) and S negative (red) tests each day since January 2021, as measured by TaqPath tests (the solid line) and by sequencing (dashed line). Figure from Early epidemiological signatures of novel SARS-CoV-2 variants: establishment of B.1.617.2 in England by members of JUNIPER.
In the plot above, the red curve shows the S-gene negative cases, showing the high prevalence of the Alpha variant in January and its subsequent falling off. "The S positive [cases, the blue curve] originally represented the wild type virus, and were higher prior to [the emergence of the Alpha variant], but have been falling ever since, until they reached a low in the middle of March," explained JUNIPER member Rob Challen, previously a medical doctor and now a postdoctoral researcher at the University of Exeter. "Since then these S gene positive tests have been increasing exponentially and this is the thing we are most concerned about."
Digging a little deeper into the available data shows the concern is valid. Some of the samples that have tested positive for COVID-19 under a PCR test go on to have their DNA sequenced, so that the exact variant can be identified. The two plots below show the result of this sequencing for some of the samples that tested positive for the S gene using TaqPath tests. The top plot shows daily counts of sequenced samples related to various variants in the period from January 2021 to the middle of May 2021 (on a logarithmic scale). The bottom plot shows the proportion of sequenced samples (on a linear scale) linked to the various variants over the same period.
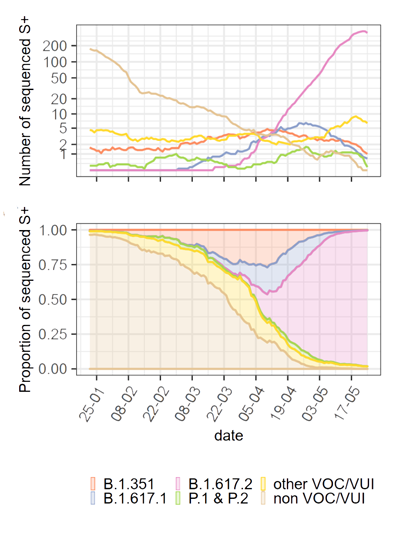
Explanation of S positive variants: B.1.351 is the Beta variant first identified in South Africa, B.1.617.1 and B.1.617.2 are the variants first identified in India (B.1.617.2 is Delta), P.1 and P.2 refers to variants first identified in Brazil (P.1 is Gamma), non VOC/VUI is the original (or wild type) variant, and other VOC/VUI refers to any other variants that are being monitored. Figure from Early epidemiological signatures of novel SARS-CoV-2 variants: establishment of B.1.617.2 in England by members of JUNIPER.
The top plot shows that the samples testing positive for the S gene were dominated by the original wild type virus in January (shown in brown), but this has been steadily declining since then. The Delta variant (shown in pink) has been growing exponentially and now dominates the S positive cases. By contrast, the curves relating to other variants have stayed relatively constant over time. (Note that at the very right of the top chart you see a very small downward drop of the pink curve, which might inspire some hope — unfortunately, though, this is due to a lag in reporting of the data from the most recent tests.)
The bottom plot shows that the Delta variant now accounts for all but a very small number of the samples that have tested positive for the S gene and have been sequenced. This means that careful analysis of the recent dynamics of S-gene positive cases gives a strong indication of the behaviour of the Delta variant.
Is Delta spreading?
In their new paper, the JUNIPER researchers estimated the growth rate of cases that tested positive and negative for the S-gene. Given that the Delta variant is now so closely related to the S-gene positive cases, and that we already knew the Alpha variant to be closely related to the S-gene negative cases, this gives a good indication of the growth rate of the Delta variant as compared to the Alpha variant. To be sure their estimates were as robust as possible the researchers used four different mathematical methods, each method based on different assumptions and modelling techniques (you can see all the details in their paper), for gleaning the growth rate from the data.
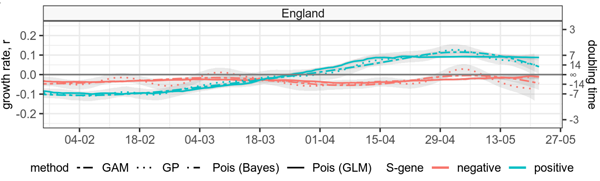
Estimated growth rate and doubling time for S-gene positive and S-gene negative symptomatic cases in England. Green lines denote S-gene positive cases and red denote S-gene negative cases. Figure from Early epidemiological signatures of novel SARS-CoV-2 variants: establishment of B.1.617.2 in England by members of JUNIPER.
The important threshold when it comes to growth rate is zero: if the growth rate is less than zero, then corresponding variants are in decline, if it is greater than zero, they are on the rise (more about growth rates here). In England, the estimated growth rate of S-gene negative cases (shown in red in the plot above) appears relatively stable and was less than zero in the observed time window, from the beginning of February to mid-May 2021. This indicates that cases were consistently declining. Conversely, you can see a clear increase in the growth rate for S-gene positive cases since the beginning of April. Since then the growth rate for S-gene positive cases is estimated to have remained above zero, with doubling times as short as 7 days in early May 2021.
The data in the plot above covers all of England, but grouping this data together could hide local trends. The researchers also zoomed their estimates of growth rates into increasingly smaller geographical areas that have good coverage for the TaqPath PCR tests.
Analysis by regions of England (the top panel below) shows that the growth rate of S-gene negative cases remained steady and below zero, but the S-gene positive cases started to increase across the regions some time in March, with particularly pronounced increases in the North West. Zooming into cities and sub-regions of the North West pin-points some of those hotspots you will have heard about in the news, where the highest growth rate of S-gene positive cases was observed.
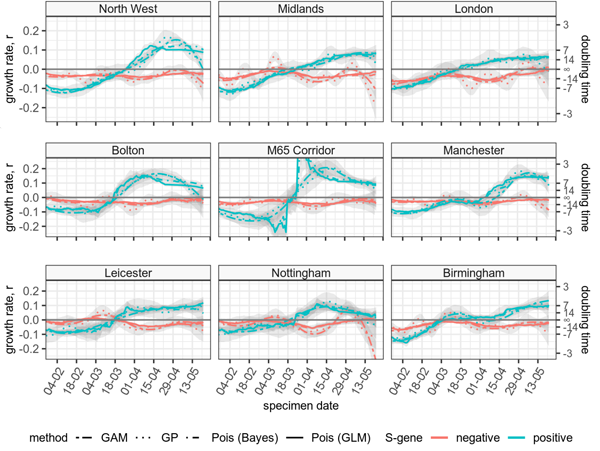
Zooming in on the estimated growth rate and doubling time of S-gene positive and negative cases in regions in England (top), cities and sub-regions in the North West (middle), and cities in the Midlands (bottom). The M65 corridor includes the towns of Blackburn, Accrington and Burnley. Figure from Early epidemiological signatures of novel SARS-CoV-2 variants: establishment of B.1.617.2 in England by members of JUNIPER.
There are of course important limitations to inferring the growth of the Delta variant from the S-gene data, rather than specifically the genomically sequenced tests. The plots shown here only represent a proportion of PCR tests that came back positive for COVID-19 because not all PCR tests are these TaqPath tests that can identify the S-gene status of the virus (for example, TaqPath tests are not used in hospitals).
"The S positive signal is complex to interpret, we have to keep in mind it could be the result of a different variant of concern or the wild type virus," said Challen. "[But] what we are seeing is concerning." A particular worry, Challen said, is that TaqPath tests are not used to the same extent in different parts of the country, so there may be other areas with a similar growth in S positive cases we are not aware of. "We might just not be seeing the signal from some regions of the UK."
How is the Delta variant being transmitted?
When cases of the Delta variant began to rise, an immediate question was whether this was due mostly to people travelling to the UK, or to the variant being transmitted within local communities. This information was hard to infer from early data, but the JUNIPER researchers came up with an interesting approach.
They used the distribution of the ages of people testing positive with COVID-19 to infer community transmission. In their paper, the researchers explain that when a disease is transmitted in the community, the age distribution of confirmed cases reflect the way the population mixes, and taking into account age specific effects such as which age groups are most susceptible (now affected by the vaccine rollout). And this age distribution should not differ substantially between variants transmitting in the community — the age distribution of the S-gene positive cases should be very similar to that for S-gene negative cases.
"When an epidemic is transmitting in the community, the age distribution of cases reflects the level of mixing between different age groups. Therefore, if both S-gene positive and S-gene negative cases are driven by community transmission, the age distributions should be similar," says JUNIPER member Christopher Overton. However, when the Delta variant started spreading in many key regions, such as Bolton and Leicester, the age distribution of S-gene positive cases changed: it skewed to older ages than S-gene negative cases. The researchers established this difference between the age distributions using two different measures, to ensure that their results were robust.
"The timing of this [change] corresponded with known cases of the Delta variant in travellers," says Overton. "Since this initial [change], the age distribution re-aligned with that of S-gene negative cases, which reflects variants known to be circulating in the community. This strongly suggests that Delta is now circulating in the wider community."
Overall, our knowledge about the Delta variant is still far from complete. There are many factors contributing to its spread and there is no direct control group to compare the Delta variant with. But the recent weeks of data and its analysis by the JUNIPER researchers gives cause for concern. "It is difficult to be totally sure that the Delta variant is more transmissible than other variants, and to put a number how transmissible it is," said Challen. "But we are seeing that Delta cases grow faster in certain regions and that could be because it is more transmissible."
About this article
This article is based on the papers Early epidemiological signatures of novel SARS-CoV-2 variants: establishment of B.1.617.2 in England and Road Map Scenarios and Sensitivity: Steps 3 and 4 by members of JUNIPER and talks given at the JUNIPER research meeting hosted by the Isaac Newton Institute on May 17, 2021.
Marianne Freiberger and Rachel Thomas are Editors of Plus.
This article was produced as part of our collaborations with JUNIPER, the Joint UNIversity Pandemic and Epidemic Response modelling consortium, and the Isaac Newton Institute for Mathematical Sciences (INI).
JUNIPER comprises academics from the universities of Cambridge, Warwick, Bristol, Exeter, Oxford, Manchester, and Lancaster, who are using a range of mathematical and statistical techniques to address pressing question about the control of COVID-19. You can see more content produced with JUNIPER here.
The INI is an international research centre and our neighbour here on the University of Cambridge's maths campus. It attracts leading mathematical scientists from all over the world, and is open to all. Visit www.newton.ac.uk to find out more.
