

Will vaccinating 12-to-15 year-olds really have an impact on the spread of COVID-19 this autumn and winter? What about the vaccine booster programme? Or measures envisioned under the UK government's Plan B, such as working from home or mandating face coverings?
These are some of the questions put to SPI-M, the Scientific Pandemic Influenza Group on Modelling, who provided a summary of their latest work last week. The answers came, in part, from two epidemiologists from the University of Bristol — Ellen Brooks-Pollock and Leon Danon — who are members of SPI-M and also of the JUNIPER modelling consortium. (Other reports were submitted by groups from Imperial College, LSHTM, and the University of Warwick).
The plot below shows the Bristol team's prediction for what might happen to the R number over autumn and winter. The R number, as most of us know by now, is the average number of people an infected person goes on to infect. An R number above 1 leads to exponential growth in infection, while an R number below 1 leads to a decline in infections.
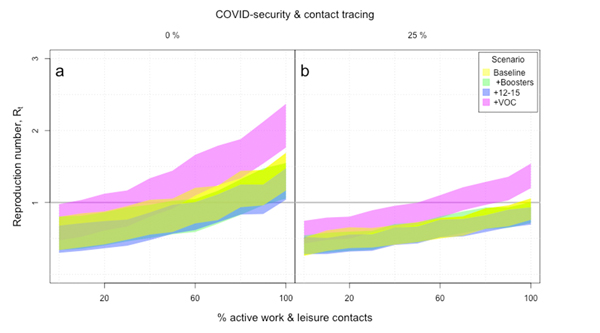
Figure 1: Estimates of the R number as a function of the percentage of active contacts. Panel A assumes no COVID mitigation measures or contact tracing, while panel B assumes both of these are in place and are 25% effective in preventing infection.
(Figure taken from the Bristol team's report, used by permission.)
The plot shows how R is estimated to change as a function of the percentage of work and leisure contacts that are active in the population: 0% would correspond to an extreme lockdown and 100% to normal, pre-COVID behaviour.
The left panel assumes that there is no COVID security (e.g. face coverings and social distancing) and no contract tracing. The right panel assumes that there is COVID security and contract tracing, and that together these two measures are 25% effective in preventing infection.
The colours represent different scenarios. Yellow is the baseline scenario, where there are assumed to be no boosters and no vaccination of 12 to 15 year olds, and where the basic reproduction number (the R number as it would be were there no interventions or vaccines at all) is equal to 7 — that's the current best guess of the transmission potential of the Delta variant in the absence of any immunity in the population. Green represents the scenario where booster vaccinations are added to the baseline. Blue represents a scenario where vaccination of 12 to 15 year-olds is added, assuming a 65% uptake. And pink represents a scenario where, in a situation where the previous two measures are present, there is a variant of concern which results in a 20% drop in the protective immunity within the population.
You can see that, in the absence of COVID security and contact tracing, and with no restrictions on work and leisure contacts, R is estimated to lie above 1, even in the absence of a variant of concern. While booster vaccinations and vaccinating 12 to 15 year olds help, COVID security and contact tracing (right panel) make a big difference, and so does restricting work and leisure contacts (to the left of the horizontal axes). A variant of concern, however, could cause considerable problems.
The ready reckoner
The team produced these estimates using their so-called ready reckoner, an ingenious ready-to-use mathematical method for estimating R. The ready reckoner is quite different from standard epidemiological modelling techniques, which simulate the spread of the disease through a population — and it's very clever.
Loosely speaking, the general idea behind the ready reckoner is to think of the population-wide R number as a weighted average over the individual R numbers of all the people in the population. This individual R number represents the number of other people the person in question would be expected to go on to infect, were they themselves infected. Someone's individual R number can be estimated from their age (which determines how likely they are to be symptomatic and infectious), their contact patterns (number, context and length of social contacts), and the probability that a contact over a given length of time results in the infection being passed on.

The idea behind he ready reckoner is to think of the population-wide R number as a weighted average over the individual R numbers of all the people in the population.
Representing the population-wide R number in this way allows you to test the effect of interventions. For example, if you want to know how closing schools would impact R, then in your estimate of the individual R numbers you simply don't count all the contacts a school-aged person has at school. If you want to know how home working affects R, then you don't count the contacts that occurred at work. If a percentage of people still go to school or work, you simply switch off a corresponding percentage of school or work contacts in your estimation of individual R numbers.
The effect of vaccination or boosters, and measures such as mask wearing and social distancing, can also be tested using this idea. Both have an impact on the chance that the infection is transmitted from one individual to another, which flows into the calculation of an individual's R number. Thus, you can take account of such measures by adjusting the parameters in the calculation accordingly.
Social contact data
The obvious objection here is that we have absolutely no way of knowing the social contact pattern of every single person in the country. However, back in 2010 a team of epidemiologists, including Matt Keeling, Jon Read and Leon Danon from the JUNIPER consortium, produced a piece of work that gives deep insights into people's social behaviour. They conducted a survey, which asked nearly 6,000 people about the contacts they had had the previous day, how long these contacts lasted, whether they involved touch, and in what context they took place: school or work, in the home, or leisure and other activities.
When it comes to calculating the average of these individual R numbers, which will serve as the estimate of the population-wide R number, the method makes a few adjustments as compared to the usual notion of average we're familiar with. For example, since people with many contacts are not only more likely to pass the infection on, but also to catch it, the average is constructed so that people with many contacts count more towards its value than people with fewer contacts.

The social contact survey asked nearly 6,000 individuals to record their social contacts on the previous day.
The ready reckoner uses this information to calculate a personal R number for each person that took part in the survey. To do this, you need to estimate the probability that a contact of a certain duration results in the infection being passed on under normal circumstances (i.e. no masks or social distancing or vaccination). This was estimated from UK data from March 2020 when no social restrictions were in place and the COVID epidemic was growing exponentially. (Note that the transmission rate in this data is scaled to reflect whatever variant is dominant in the period you are considering.)
Also, because what we want is an estimate for the R number for the entire population, rather than just the 6,000 strong sample, there is an adjustment in the calculation of the average which relates to age, whereby each person in the survey effectively represents around 10,000 "similar" people in the general population. Age is chosen as the focus here, because it is a hugely important indicator when it comes to contact patterns: children tend to go to school, twenty-somethings tend to have active social lives, and older people tend to spend more time at home. To make sure the population wide R number is representative of the entire population, the average is constructed so that people from an age group that is under-represented in the sample (as compared to the whole population) contribute more towards its value than people from an over-represented age group.
To see the mathematical details of these calculations, have a look at this paper by Ellen Brooks-Pollock, Jonathan Read, Angela McLean, Matt Keeling and Leon Danon.
The adjusted average now gives you an estimate of the true population-wide R number, and you can gauge the impact of interventions as explained above. For example, switching off 80% of non-household social contacts in the ready reckoner produced estimates of that R was around 0.7 during the April 2020 lockdown, remarkably similar to direct estimates and providing proof that this approach is useful.
This description gives the gist of the idea behind the ready reckoner, but it's a simplification. The actual mathematics is more involved, and of course it's hugely important to have good estimates of the important parameters from the available data. For example, you need to have a good estimate of the effect of vaccines, boosters and natural immunity, and also the fact that this immunity can wane.
For their latest report, the Bristol team used data from a study by the Office of National Statistics regarding the presence of antibodies in the population to gain information of the amount of immunity present in the population. They also made a number of other assumptions, which you can read about in their report.
Cases and deaths
Although the R number is useful for describing whether the epidemic will go up or down, what is really needed is the number of cases and the number of deaths. These can be approximated using R.
As described above, at the beginning of an epidemic, when nobody is immune and people are behaving normally, the R number is given by the basic reproduction number. However, as people become immune the R value will drop, as there are now fewer people who can catch the disease. When R equals 1 the number of cases peaks and the epidemic turns over; after that R continues declining towards zero. To estimate the total number of infections, you total up all of those cases.
The number of people not infected
The number of people who escape an infection during an epidemic is usually denoted by $S_{\infty}$. It can be calculated from the equation $$S_{\infty} = exp\left(-R_0\left(1-S_{\infty}\right)\right).$$
Unfortunately, there isn't a formula for the total number of cases, but you can calculate the converse — the number of people not infected during an epidemic — numerically using the equation in the box.
Following some late-night mathematics with Lorenzo Pellis, also from JUNIPER, the Bristol team came up with an equivalent calculation using the social contact survey data to use in the ready reckoner framework. They then estimated the number of deaths from the number of cases together with information about mortality.
This gave the Bristol team the following estimates for the autumn and winter. If everybody returns to pre-pandemic behaviour patterns and no restrictions are put in place, then the estimated total number of cases over this period would be between 5.7 million and 6.3 million and the estimated number of deaths would be between 7,500 and 9,100.
Including a booster programme would reduce the estimated number of cases to between 4.9 million and 5.4 million and the estimated number of deaths to between 5,200 and 6,300. And adding vaccination of 12-to-15-year-olds would reduce the estimated number of cases to between 3.4 million and 3.8 million and the deaths to deaths between 3,200 and 3,800.
Finally, the team found that a variant of concern that leads to a 20% reduction in protection can have a huge impact: it would drive the numbers of cases the between 21 million and 22 million and numbers of deaths to between 91,000 and 106,000.
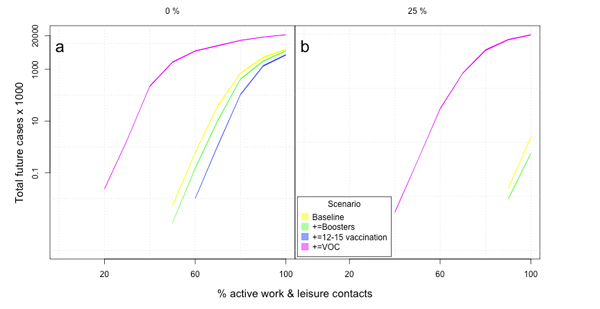
Figure 2: Estimates of the total number of cases over the autumn and winter as a function of the percentage of active contacts. The colours have the same meaning as in figure 1. The left panel assumes zero COVID security and contact tracing and the right panel assumes COVID security and contact tracing that are 25% effective in preventing infection. Figure taken from the Bristol team's report, used by permission.
It is important to remember that the estimates calculated are total numbers of cases and deaths over this autumn and winter. The ready reckoner approach cannot say whether the majority of those cases occur in a concentrated period of time or whether they are evenly spread out over a number of months. This is important as the former situation could put significant pressure on the health system, even if the overall number of cases remains relatively low. So it is important to consider these estimates of total cases numbers alongside other projections, such as the epidemic trajectory scenario modelling from the University of Warwick, which you can read about here.
As all mathematical methods designed to understand the pandemic, the ready reckoner doesn't give us certainty about what's going to happen. But it's an ingenious method for making best use of the information we have about people's contacts to give us a sense of what might be in store.
About this article

Ellen Brooks Pollock and Leon Danon.
Marianne Freiberger is Editor of Plus. She would like to thank Ellen Brooks-Pollock, Leon Danon and Ciara Dangerfield for their help in writing this article.
This article is part of our collaboration with JUNIPER, the Joint UNIversity Pandemic and Epidemic Response modelling consortium. JUNIPER comprises academics from the universities of Cambridge, Warwick, Bristol, Exeter, Oxford, Manchester, and Lancaster, who are using a range of mathematical and statistical techniques to address pressing questions about the control of COVID-19. You can see more content produced with JUNIPER here.
