Home
plus.maths.org

Secondary menu

  • My list
  • About Plus
  • Sponsors
  • Subscribe
  • Contact Us
  • Log in
  • Main navigation

  • Home
  • Articles
  • Collections
  • Podcasts
  • Maths in a minute
  • Puzzles
  • Videos
  • Topics and tags
  • For

    • cat icon
      Curiosity
    • newspaper icon
      Media
    • graduation icon
      Education
    • briefcase icon
      Policy

    Popular topics and tags

    Shapes

    • Geometry
    • Vectors and matrices
    • Topology
    • Networks and graph theory
    • Fractals

    Numbers

    • Number theory
    • Arithmetic
    • Prime numbers
    • Fermat's last theorem
    • Cryptography

    Computing and information

    • Quantum computing
    • Complexity
    • Information theory
    • Artificial intelligence and machine learning
    • Algorithm

    Data and probability

    • Statistics
    • Probability and uncertainty
    • Randomness

    Abstract structures

    • Symmetry
    • Algebra and group theory
    • Vectors and matrices

    Physics

    • Fluid dynamics
    • Quantum physics
    • General relativity, gravity and black holes
    • Entropy and thermodynamics
    • String theory and quantum gravity

    Arts, humanities and sport

    • History and philosophy of mathematics
    • Art and Music
    • Language
    • Sport

    Logic, proof and strategy

    • Logic
    • Proof
    • Game theory

    Calculus and analysis

    • Differential equations
    • Calculus

    Towards applications

    • Mathematical modelling
    • Dynamical systems and Chaos

    Applications

    • Medicine and health
    • Epidemiology
    • Biology
    • Economics and finance
    • Engineering and architecture
    • Weather forecasting
    • Climate change

    Understanding of mathematics

    • Public understanding of mathematics
    • Education

    Get your maths quickly

    • Maths in a minute

    Main menu

  • Home
  • Articles
  • Collections
  • Podcasts
  • Maths in a minute
  • Puzzles
  • Videos
  • Topics and tags
  • Audiences

    • cat icon
      Curiosity
    • newspaper icon
      Media
    • graduation icon
      Education
    • briefcase icon
      Policy

    Secondary menu

  • My list
  • About Plus
  • Sponsors
  • Subscribe
  • Contact Us
  • Log in
  • Maths in a minute: Ensemble forecasting

    15 December, 2022

    Weather forecasts are never 100% certain, as you will see when you look at you weather app. Rather than telling you that it's definitely going to rain or not, it'll tell you a percentage chance. For example, at this very moment my app says the chance of rain today is only 10%.

    To see how meteorologists work out these chances, we first need to revisit an old friend, the famous butterfly effect. Meteorologists use mathematical models that can simulate the weather to make their forecasts (you can find out more about these models here). To start off a simulation they need to measure the current values of things like temperature and pressure and feed these to the model. The butterfly effect means that a small inaccuracy in the starting values fed to the model can grow as the model runs through all the calculations necessary to make the forecast. This means that the forecast you get as the output can end up being very inaccurate. Indeed the butterfly effect, also known as sensitive dependence on initial conditions, was first discovered in connection with weather forecasting, find out more here.

    Ensemble forecasting is one way of dealing with this problem. Rather than running the weather model just once, meteorologists run it many times, each time with slightly different values for the starting conditions. This gives them a whole ensemble of forecasts. If all these forecasts are very similar, then that means the butterfly effect isn't too pronounced and you can be quite certain the forecasts are accurate. If the forecasts vary widely, then you know that you can't be too certain.

    The ensemble of forecasts also gives you the percentage chance you see in your app. If only 10% of the forecasts in the ensemble say that it'll rain, then that's the 10% you see on the app.

    TEnsemble of forecasts

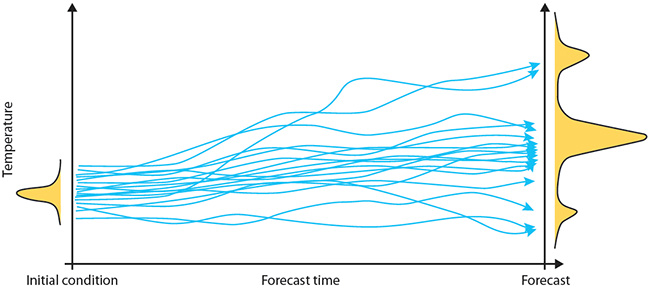
    An ensemble of forecasts produces a range of possible scenarios rather than a single predicted value. The distribution of the ensemble members gives an indication of the likelihood of occurrence of those scenarios. Figure from the ECMWF website, CC BY-SA 4.0.

    Ensemble forecasting was pioneered by the climate scientist Tim Palmer, and can be used in other situations too, for example when forecasting the behaviour of a pandemic. To find out more listen to Palmer himself talk about ensemble forecasting, uncertainty more generally, as well as climate change in our podcast.


    This article was produced as part of our collaboration with the Isaac Newton Institute for Mathematical Sciences (INI) – you can find all the content from the collaboration here.

    The INI is an international research centre and our neighbour here on the University of Cambridge's maths campus. It attracts leading mathematical scientists from all over the world, and is open to all. Visit www.newton.ac.uk to find out more.

    INI logo

    • Log in or register to post comments

    Read more about...

    INI
    meteorology
    weather forecasting
    mathematical modelling
    maths4DL

    Our Podcast: Maths on the Move

    Our Maths on the Move podcast brings you the latest news from the world of maths, plus interviews and discussions with leading mathematicians and scientists about the maths that is changing our lives.

    Apple Podcasts
    Spotify
    Podbean

    Plus delivered to you

    Keep up to date with Plus by subscribing to our newsletter or following Plus on X or Bluesky.

    University of Cambridge logo

    Plus is part of the family of activities in the Millennium Mathematics Project.
    Copyright © 1997 - 2025. University of Cambridge. All rights reserved.

    Terms