Blink and you'll miss it: The free kick in football (part II)
The free kick in football: the referee blows the whistle, the striker begins his run-up and the players in the wall steel themselves against a possible impact. The goalie strains to see his first sight of the ball and the thump as boot meets ball can be heard all over the now-silent ground.
That's how we ended Part 1 of this article: at the instant the ball was kicked. Our aim is to continue the drama: to trace the flight of the ball from foot to goal. Mathematics allows us to do just that. In this article we will look at the trajectory of a ball, as predicted by the equations that describe the underlying physics and our research into goalies' reaction times. Comparing such a modelled trajectory to real ones gives important insights into ball design and tactical considerations.
Apart from the very fleeting (but important) contact of foot and ball during the kick, what happens throughout the remaining part of the flight is largely governed by aerodynamics. So let's take a quick look at the basics.
Aerodynamics in a nutshell
There are only three forces acting on a moving, spinning ball. These are gravity, aerodynamic drag and aerodynamic lift. Gravity pulls the ball downwards, drag slows it down and lift, caused by the ball's spin, makes it deflect in flight. These effects, aerodynamic drag especially, are discussed in more detail in this Plus article. Suffice to say here that drag forces suddenly switch from high to low values at a particular speed: a ball moving below that speed will experience more drag than a ball travelling above it. These striking video images, produced by Prof. Takeshi Asai of the University of Tsukuba in Japan, illustrate this.
Movie 1 shows a kick at normal speed. The ball has been coated with a substance which emits a dense white vapour and so in flight it essentially trails its aerodynamic signature.
Movies 2, 3 and 4 were recorded using a high speed camera so events are seen in slow motion. In movie 2 the ball is not moving quickly enough to trigger the transition from high to low drag. As you can see there is a lot of turbulence, the agency that causes aerodynamic drag, in the ball's wake. Notice how the flow separates from the ball at the top and at the bottom.
In movie 3, however, the ball has speeded up and the switch has occurred. The flow separation moves more towards the rear of the ball and turbulence in the ball's wake has been greatly reduced.
Finally, movie 4 shows the flow pattern for a ball rotating with backspin about a horizontal axis. Flow separation is delayed on the upper surfaces and advanced on the lower parts, leading to a pressure gradient which deflects the ball upwards in flight in this case. This is the classic Magnus effect first observed by the German physicist Heinrich Gustav Magnus in 1852. To move the ball sideways it must be spun about a vertical axis, and if the spin axis can be tilted beyond the vertical, a downward-pointing component of the Magnus force results. The ball will both swerve and dip in this case, very disconcerting for goalkeepers.
So we have our ball in flight, speeding towards the goal. At this stage, certain interesting questions arise such as "how long will it take for the ball to reach the goal line?", or "how fast is the ball moving at a certain point?". Modelling the flight to obtain a realistic trajectory is therefore a must. This can be done if all of the essential input parameters are known: the exact method is described in this Plus article. No exact solutions to the relevant equations (i.e. solutions in terms of familiar mathematical functions) are known. Fortunately, however, there are many computer packages available which enable you to find numerical solutions to any degree of precision required. This is how we arrived at the modelled trajectory shown below.
Defining the critical points
But before looking at this modelled trajectory it's helpful to focus on the key events. In the image below point (1) is the instant of the kick and point (2) marks the ball's crossing of the defensive wall. Points (2) and (3) are highly significant for the goalkeeper. He or she first sees the ball at point (2) but no movement is possible until all of the visual information has been assimilated and processed. The first movement by the goalie is at point (3), just before the highest point of the trajectory (4), and whether this action is decisive determines whether a goal or a save occurs at point (5).
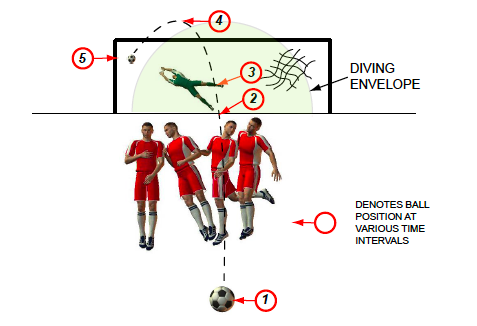
Figure 5: Ball trajectory in a free kick (schematic).
Let's look at each of these critical points in detail. The modelled trajectory is shown in side view and plan format in Figure 6, with points (1) to (5) accurately labelled in terms of ball positions and corresponding times. Milliseconds (ms) will be used for the time intervals bearing in mind that a typical free kick lasts about one second or 1000 ms.
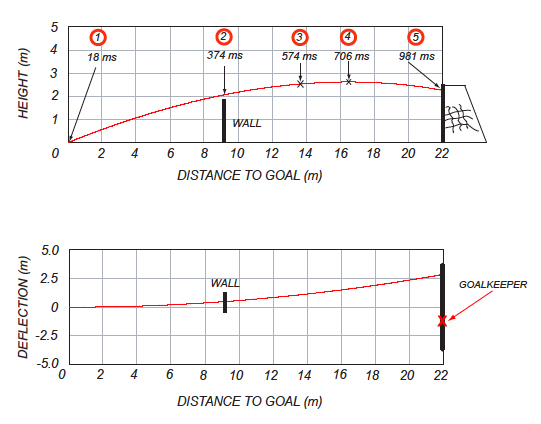
Figure 6: Simulated free kick with critical time-points on trajectory. Side view (top) and plan view (bottom)
Point (1): The kick
This phase lasts between 16 and 20 ms, depending on the ball's internal pressure. But virtually everything of physical importance is determined in this instant. Ball speed following the kick can be calculated from the first equation in Part 1 of this article. Spin is achieved by striking the ball with a line of impact offset from the ball's centre — we'll assume that the ball spins about a vertical axis so the Magnus force will be horizontal and the ball will be deflected sideways, from right to left.
The ball's initial direction and elevation (angle of kick relative to the ground) are determined by the astuteness of the striker who must weigh up the geometry of the free kick position and the size of the defensive wall (see the figure below). For our model we'll consider a central free kick exactly 22 m from the goal. We will also assume an initial ball speed of 27 metre/sec and a spin rate of 600 rpm will be assumed. Finally the initial direction of the shot is down the centre line to the goal with an initial elevation of 16.5 degrees. Looking ahead, with these input parameters, our model predicts that the ball will cross the goal line 981 ms after the first point of contact. But a lot can happen on the way.
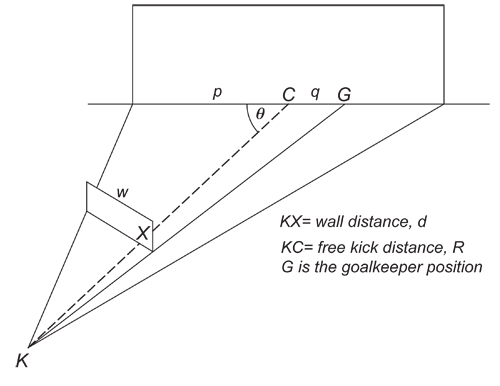
Figure 2: The geometry of defensive wall position (see Part 1 of this article for an explanation).
Point (2): Goalie's first sight of the ball
The ball passes the defensive wall after 374 ms. Let's assume that the defenders, despite jumping, have been ineffectual in blocking the shot. The ball's absolute speed has reduced to 23.5 metre/sec at this stage. It's important to note, though, that the ball is still rising and moving sideways. But the most important point is that this is the goalie's first sight of the ball, because the melee of defenders and attackers in the wall has blocked his view of the actual shot. Seeing the ball at this instant is not the same as reacting, however, as the following indicates.
Point (3): Goalie's reaction time and response
Athletes' reaction times are often the determining factor in explosive events, such as sprinting, where values of 120 – 160 ms are not unusual. The only response required by a sprinter is to get moving and it is known that audible stimuli such as the starter's gun are assimilated much more rapidly than visual cues. A top goalkeeper's reaction time will be longer given the visual nature of his cue and the fact that much more predictive processing of the ball's movement will be needed. For the purposes of modelling we assume a value of 200 ms. This implies a further delay while the clock ticks relentlessly on. After this phase (574 ms) the ball's absolute speed has reduced to 22.1 metre/sec and the goalie realises that he needs to make up ground rapidly by moving sharply to the right along the goal line. For the remaining duration of the flight he is making judgements and predictions of the ball's likely end point and must do this on the run, a very demanding task in practice.
Point (4): The ball reaches its apex
The highest point in the trajectory occurs after 706 ms. The ball's absolute speed at this point is 21.4 metre/sec and events have reached the point where the goalie, having made the best estimate of the ball's likely finishing position must now commit to a dive. Even if the goalkeeper has managed to reach the centre of the goal line, so that the diving envelope (see Part 1) is optimally placed, he still needs to make a diving attempt. Our research at Bath shows that to dive to the extremity of the envelope takes around 400 ms at best, and in our simulated kick there are just 275 ms left before the ball reaches the goal line. Much depends therefore on the ball's position in relation to the envelope when it crosses the line.
Point (5): The ball reaches the goal line
Time's up! The model predicts that the finishing position of the ball will be exactly as shown in figure 7 and a goal results despite the goalie's best efforts. The ball crosses the line at 20.1 metre/sec, a substantial reduction from the 27 metre/sec initial speed. It has also deflected some 3 metres laterally, underlining the potency of sidespin kicking in practice.
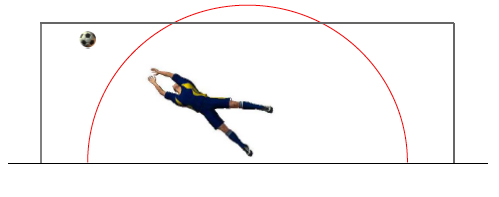
Figure 7: Final ball position in 22 m free kick.
Postscript
Mathematical modelling is fun, especially if it can be related to the world's most popular sport. But there's a practical dimension too. Matching an accurate model to a measured trajectory is a very powerful way of extracting the important aerodynamic variables that determine how drag and spin influence the ball's flight under real environmental conditions. And there is much to learn about the tactical importance of free kicks in the modern game, a much under-researched area where opinion is too often passed off as fact. Should a striker really be attempting a shot from that position? Are there sufficient defenders in the wall? Is a wall really necessary, and would it be better if the goalie had a clear view of the shot?
Model it and find out!
About the author

Ken Bray is a theoretical physicist and a Senior Visiting Fellow in the Faculty of Engineering and Design at the University of Bath, UK. He has made a special study of the mathematics of football and the factors affecting the ball's flight, and has lectured, broadcast and published widely for both academic and general audiences. He has gone on record as saying that as much as 30% of a footballer's technique is down to an intuitive understanding of maths and science (although they shouldn't go anywhere near a computer!).
His book How to score: Science and the beautiful game has been reviewed in Plus. The author gratefully acknowledges provision of the experimental ball launching machine by the BOLA company of Cotham in Bristol.
Comments
Anonymous
Enjoyed the piece - very interesting.
Have you modeled alternative walls? For example, a two part wall with a gap between the middle? That could both increase the keeper's visibility, cover more of the "unsaveable" zones with the wall and allow the keeper to stand centrally and thus reach more kicks that go into the corners.
Tim Hammond (thammond65@hotmail.com)
Anonymous
Thanks very much Tim: yes, I have investigated alternative walls, both the split wall you suggest and a kind of two-layer set up with a smaller secondary wall behind the first. The problem, as mentioned in the article, is that gaps rapidly get filled (to un-sight the goalie) or, in the case of a secondary wall, it simply gets enlarged for the same purpose. Interesting too is the fact that scoring free kicks are becoming rarer, as evidenced in Brazil: wonder why??
One innovation was the very clever free kick taken by the USA (I think against Belgium), which had all of the characteristics of a "play" in American football and involved several linked components and not simply a direct shot. Maybe things are going more that way - more scope for modelling!
Ken