
It may feel like a lifetime ago, but it's only two years since many of us were eagerly awaiting our first dose of a COVID-19 vaccine, an important step out of the restrictions we'd been enduring.
Luckily, we all knew where we stood because the order of vaccination in the UK was straight-forward. Care home residents and staff formed the first priority group. After that it went by age group, working downward from the oldest, with clinically vulnerable people and frontline health and social care workers also included among the first priority groups. The idea was to quickly protect the most vulnerable and to keep the healthcare system going.
Hindsight allows us to assess the UK's vaccination strategy.
This approach was recommended for England by the Joint Committee for Vaccination and Immunisation (JCVI) in December 2020, but it wasn't the only choice JCVI could have made. Another would have been to start by offering the vaccine, not to the most vulnerable, but to those most likely to spread the disease.
This would have meant that younger people, who were driving transmission at the time, would have come first. With transmission reduced, vulnerable people would have been protected too. Generally when you're dealing with an infectious disease for which there is a vaccine it's not immediately clear which of the two strategies — prioritising the vulnerable or prioritising high transmitters — would do a better job in terms of minimising hospital admissions and deaths.
With its vaccine prioritisation the UK was roughly in line with most other countries offering a vaccination programme, but there was another decision taken in early 2021 that made the UK stand out with initially only Canada acting similarly: to increase the time between the first and second vaccine doses from three weeks to twelve weeks.
This was done partly because of emerging evidence that the AstraZeneca vaccine, the main early component of the UK vaccine programme, worked better with a longer interval. But it was also a question of prioritisation. With limited vaccine doses and means to deploy them, and the Alpha variant bearing down on us, optimal use of the available resources was key. Increasing the interval between first and second dose meant that more people were quickly offered the partial protection of a single dose. Keeping the interval short would have meant that fewer people were quickly offered the full protection of a double dose. The decision of which option to go for was not clear cut. (Later on in May, when hospital admissions rose and there was concern over the level of protection offered by just one dose again the Delta variant, the interval was reduced back down to eight weeks.)
At the time, JCVI had to make these decisions rapidly and based on limited data. Now, with the benefit of hindsight, can we tell whether it made the right choices?
See here for all our coverage of the COVID-19 pandemic.
It's a question a team of epidemiologists from the JUNIPER modelling consortium recently addressed in Nature Communications. The answer they came up with is "yes". Their work shows that first offering the vaccine to the most vulnerable groups had the biggest immediate impact compared to other strategies. The twelve week gap was also beneficial: the team estimated that it averted between 32,000 and 72,000 hospital admissions and between 4,000 to 9,000 deaths over the first ten months of the vaccination campaign.
The team behind this latest study forms part of a research group at the University of Warwick whose results played an important role in informing UK policy during the pandemic. Among other things, they were one of several groups that helped direct the roadmap, which eventually got us out of lockdown in 2021, and contributed to the modelling group SPI-M-O which fed its results to the Scientific Advisory Group for Emergencies (SAGE) .
The group's mathematical models, designed to give a sense of how the pandemic might develop from given starting conditions, have proved remarkably accurate (find out more here). The group's director, Matt Keeling, was a member of JCVI and contributed to its advice at the time. This latest effort meant appraising these recommendations through the critical lens mathematical modelling can provide.
Different scenarios
At the heart of the study that appeared in Nature Communications lies a complex mathematical model which can simulate how an epidemic might evolve - or in this case, might have evolved - based on a set of assumptions. The model captures the age structure of the population (in terms of social mixing and risk of severe illness), as well as the effect of vaccination and different variants of the virus - you can find out more about the model at the end of this article.
Armed with this model the team set out to explore what might have happened had the vaccination strategy been different. They considered four different scenarios:
- Implemented strategy: A scenario that reflects what actually happened.
- Order of vaccination reversed: A scenario in which the vaccination order is reversed so that the youngest adults, most responsible for transmission, are vaccinated first, but the interval between first and second dose is fixed at twelve weeks.
- Shorter interval - same effect: A scenario in which people receive the first dose in the same order that was implemented in reality, but where second doses are given after a three week interval. In this scenario the vaccines are assumed to work as well as they do for a twelve week interval.
- Shorter interval - less effective: A scenario that's the same as scenario 3 above, but where the potential difference in the efficacy of the vaccines when the interval is shorter is also captured.
The results
The charts below show the results of the modelling work for the period from October 2020 to October 2021. The top chart shows estimated daily deaths and the bottom chart estimated hospital admissions.
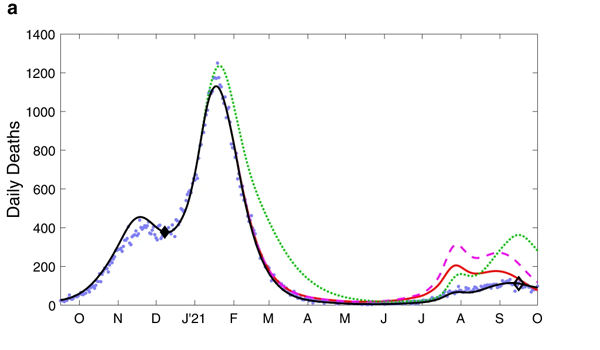
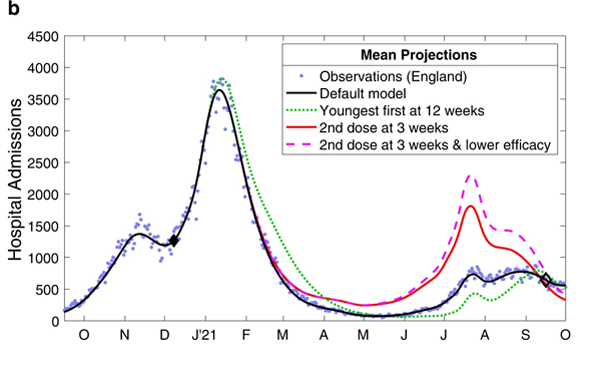
These charts compare the observed levels of deaths (top) and hospital admissions (bottom) for the four scenarios mentioned above. Figure from The impacts of SARS-CoV-2 vaccine dose separation and targeting on the COVID-19 epidemic in England by Keeling et al.
The blue dots represent observed data, that is, deaths and hospital admissions as they actually occurred. The black line represents model outputs for the first scenario, reflecting the vaccination strategy that was actually implemented — you can see it closely follows the blue dots. The green dotted line represents scenario 2, where the order of vaccination is reversed. The red line and purple dashed line represent scenarios 3 and 4, where the interval between first and second vaccine doses is only three weeks.
When it comes to deaths (top chart), scenario 1 - reflecting the strategy that was actually implemented - clearly performed better than scenarios 2, 3 and 4. For hospital admissions (bottom chart), only scenario 2 (reverse order of vaccination) performs better than the others but only from about June 2021 onwards, when the Delta variant caused a new wave.
We can also look at what this means in terms of the total additional deaths and hospital admissions that would have occurred in scenarios 2, 3 and 4, compared to the default scenario 1. This is shown in the charts below. The shaded regions around the actual lines represent uncertainty surrounding the estimates.
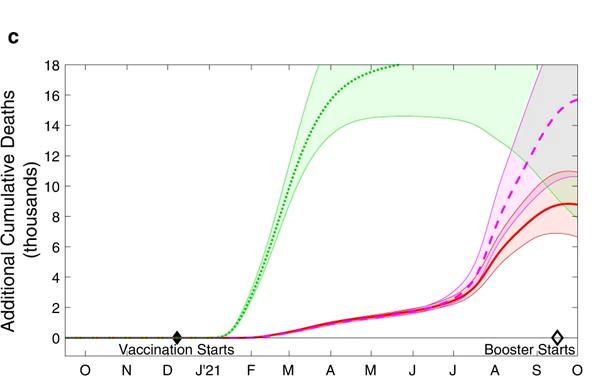
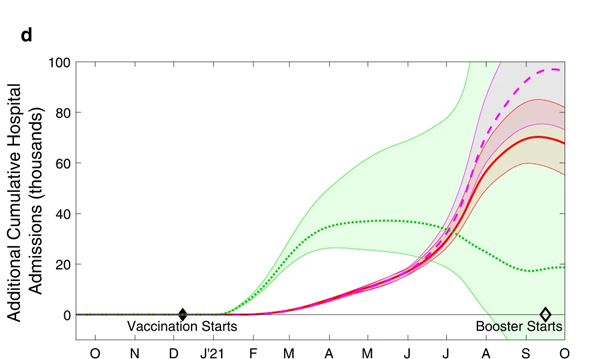
The cumulative additional deaths (top) and hospital admissions (bottom) projected from alternative assumptions. As before the green dotted line represents scenario 2, where the order of vaccination is reversed. The red line and purple dashed line represent scenarios 3 and 4, where the interval between first and second doses is only three weeks. The shaded regions are 95% prediction intervals: they represent a 95% confidence that the true value lies somewhere in this region. Figure from The impacts of SARS-CoV-2 vaccine dose separation and targeting on the COVID-19 epidemic in England by Keeling et al.
Further modelling work, exploring all sorts of vaccination orders, support what these charts suggest: the strategy that was actually adopted appears close to optimal as far as deaths are concerned. Only when you look at the total number of hospital admissions over the longer term (after the wave due to Alpha and including the Delta wave) does this simple strategy become suboptimal: during those later stages we may have seen fewer hospital admissions had we switched to a strategy that generates a broad level of immunity across the entire population.
All this confirms what your intuition may have already suggested to you. When there is a lot of infection in the population, as there was in late 2020 and early 2021, vulnerable people need to be protected quickly, there is no time to wait for a vaccination strategy that prioritises people who drive transmission to become effective. If, however, the level of infection in the population is low, first offering the vaccine to high transmitters may pay off.
More generally, there isn't a single vaccination strategy that's optimal for all diseases in all situations. A lot depends on the characteristics of a disease and any vaccines, the make-up of a population and the range of ways individuals respond to an infection, and what phase of an epidemic you're in.
Other factors are also important. For example, the strategy recommended by JCVI had the advantage of being easy to understand. Had we been presented with a confusing array of instructions as to who should be vaccinated when, fewer people may have gone to get the jab.
Reality is more complex than any model
Like all mathematical models, the one employed by the JUNIPER researchers is a simplification of reality based on a set of assumptions that may only be an approximation to real events. For example, the team assumed that for all four scenarios they investigated, people's behaviour would be the same as it was in reality: people would display the same level of caution about catching the disease as they did in reality, and the vaccine uptake in each age group would also be the same.
That's probably not how things would have turned out. For example, if younger people had been vaccinated first, and deaths and hospital admissions had remained high as a result of not protecting the vulnerable, then people might have changed their precautionary behaviour, and the vaccine uptake in the age groups offered the vaccine may also have been different.
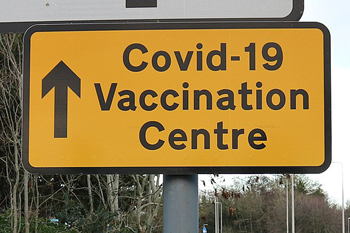
A good thing about the adopted vaccination strategy in the UK was that is was easy to understand. Photo: KY Chow, CC BY-SA 4.0.
It's crucial to be aware of the limitations of a model and the uncertainties within its outputs. These outputs are never certain predictions of what's going to happen or, in this case, what would have happened. They can, however, be seen as extremely sophisticated guesses that take into account a web of factors and a range of information so wide and complex that only the mathematical approach will do.
All things considered, the JUNIPER team believe their modelling work gives good evidence that the decisions taken by JCVI were the best that could have been made at the time, and were a robust, workable and simple test of priorities. "Public health decisions often have to be made on the basis of limited data and therefore need to be as robust as possible to potential changes in scientific understanding," they write in their paper.
"The advice given by JCVI in late 2020 and early 2021, was based on very limited data about vaccine efficacy against the newly emerged Alpha variant, and with no knowledge of the forthcoming waves of infection or the waning of protection [provided by the vaccines]. Under such conditions a simple yet precautionary strategy is optimal, rapidly providing broad protection to those individuals that need it the most."
The model
At the heart of the study that appeared in Nature Communications is a so-called SEIR model. Widely used in epidemiology, SEIR models divide the population into groups according to their disease status: those who are susceptible to catching the disease (S), those who've been exposed to it but aren't yet infectious (E), those who are infectious (I) and those who are recovered or, sadly, dead (R).
The rate at which people pass from one class to another can be described using mathematical equations (differential equations to be precise). The equations depend on parameters that capture the particularities of the disease and the world it is spreading in: how easily people become infected, how long until they become infectious and then recover, the chance they die, etc. The values of these parameters can be estimated from data that was collected in the real world. (You can find out more detail about this type of model in Matt Keeling's Plus article The mathematics of diseases.)
Once you have estimated your parameter values you can use a computer to simulate people's passing from one group to another to get a sense of how the epidemic may unfold. That's the general idea, but because the reality the JUNIPER team wanted to explore was a lot more complex, they hugely expanded the simple SEIR set-up by adding additional groups.
The susceptible group S, for example, was split into several subgroups depending on vaccination status. The exposed group E was divided into subgroups reflecting the fact that people respond differently to being exposed. The infectious group I was divided into people who have symptoms and people who don't, and also according to which variant a person is infected with. The diagram below gives you a sense of this approach.
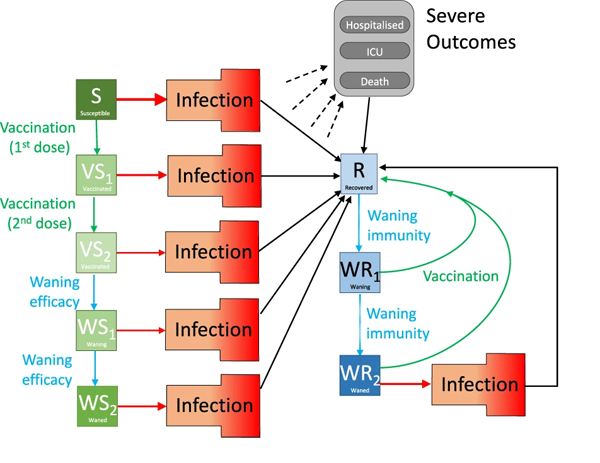
The diagram shows various compartments of the model and the flow between them. Infection is shown as a red arrow (with the size providing some indication of the risk), recovering is shown by black arrows, the two-dose vaccination is shown in green, while waning protection is in light blue. The "Infection" compartment was itself split into further subgroups. Figure from The impacts of SARS-CoV-2 vaccine dose separation and targeting on the COVID-19 epidemic in England by Keeling et al.
In addition, because age was key in determining the severity of COVID-19 infection, the model blueprint was replicated 21 times to reflect 21 five-year age groups (0-4 years, 5-9 years, and so on through to 95-99 years, and finally 100+ years), and a further seven times to reflect the dynamics of the epidemic in seven different geographical (NHS) regions in England. Crucially, the model also includes a parameter that reflects how cautious people were — how much they mixed with others, and whether they tested and isolated, for example.
The value of all the parameters in the model — the infectiousness of a given variant, the protection a vaccine provides against infection, the precautionary parameter, etc — were carefully estimated from the available data collected at the time. (To find out more about the different components of the model and how they combine to form the full model, see the team's paper.)
To simulate the different scenarios using the model, you change the order in which age groups run through the vaccination related classes of the model, and the time frame in which they do so.
About this article
This article is based on the paper The impacts of SARS-CoV-2 vaccine dose separation and targeting on the COVID-19 epidemic in England by Keeling et al, which appeared in Nature communications in February 2023.
Marianne Freiberger is Editor of Plus. She would like to thank Ed Hill and Matt Keeling for their help with this article.
This article is part of our collaboration with JUNIPER, the Joint UNIversity Pandemic and Epidemic Response modelling consortium. JUNIPER comprises academics from the universities of Cambridge, Warwick, Bristol, Exeter, Oxford, Manchester, and Lancaster, who are using a range of mathematical and statistical techniques to address pressing questions about the control of COVID-19. You can see more content produced with JUNIPER here.
