A formula for Europe
When you try to put democracy into action you quickly run into tricky maths problems. This is what happened to Andrew Duff, Liberal Democrat MEP for the East of England. In his role as rapporteur for the European Constitutional Affairs Committee, Duff was charged with recommending a fair way of allocating seats of the European Parliament to Member States. Wisely, he went to ask the experts: last year he approached mathematicians at the University of Cambridge to help come up with a solution. A committee of mathematicians from all over Europe was promptly formed and today it has published its recommendation.

Up until now, seats of the European Parliament have been allocated to Member States through political bartering
Up until now, seats of the European Parliament have been allocated to Member States through political bartering, rather than a rigorous process. "Whenever a country joined the Union or there was a new election, the leaders got together and decided how to split the seats between Member States," explains Geoffrey Grimmett, Professor of Mathematical Statistics at Cambridge, who led the committee. "But there is a feeling that as more and more states join the EU there needs to be some principled approach to how seats are apportioned, to which all of the EU can sign up." What is needed is a mathematical method to replace the political horse trading.
But what kind of formula gives a fair solution? It may seem natural that representation of Member States should be proportional to the sizes of their populations, with larger states getting more seats than smaller ones. On the other hand, no single large state should be able to dominate the EU and the voices of very small states should not be drowned out. This is reflected in existing conventions: every state, even Malta which is the smallest with a population of around 400,000, is guaranteed at least 6 seats. Similarly, no state, not even Germany which with a population of around 82 million is the largest state in the EU, is allowed more than 96 seats.
But apart from these two constraints there's another, more subtle principle which has emerged for making sure that people from smaller states retain their voice. It's called degressive proportionality. If you divide the population of a country by the number of seats it has in Parliament, you get a measure of how many people in that state are represented by one MEP. As an example, if a state has a population of 100,000 and 10 seats in parliament, then there is 1 MEP for 10,000 people. In theory, the fewer people are represented by one MEP, the louder their individual voices are in the European Parliament. The idea of degressive proportionality is that while larger states should get more MEPs in total than smaller ones, smaller states should have fewer people per MEP than larger ones. "This is an attractive way of trying to underwrite the level of representation of people in smaller states," explains Grimmett.
Any fair apportionment formula, so experts agree, should satisfy degressive proportionality and also make sure that every country gets at least 6 and at most 96 seats. In addition — for making sure the Parliament doesn't grow too big — it's agreed that there should be exactly 751 seats in total.
It's a perfect problem for mathematicians to get their teeth into, but the experts in this case were not allowed to let their mathematical expertise run away with them. There were three non-mathematical constraints to ensure the solution is practicable. "The first was that the system should be durable with respect to changes in size and shape of the EU," says Grimmett. "The second was that it should be transparent, we should be able to explain it to people. And the third was that the system should be impartial to politics, it shouldn't favour particular groups or nations. We discussed a variety of different methods and decided unanimously that there was one method which met the constraints better than all the others."

The method is called base+prop and it's indeed reasonably straight-forward. The general idea is to start with a base number $b$. Every Member States automatically gets $b$ seats. The remaining seats are distributed proportionally to population: a state with a population of $p$ gets $b+p/d$ seats, where the number $d$ is the same for each country. If for a larger state the number $b+p/d$ is bigger than 96, then you overrule the calculation and cap the number of seats at 96.
As an example, if we choose $b=5$ and $d=1,000,000$, then a country with a population of 5 million gets $5+5=10$ seats and a country with a population of 10 million gets $5+10=15$ seats.
This method clearly guarantees that a larger state gets at least as many seats as a smaller one and a quick calculation shows that it also satisfies degressive proportionality. But there are two problems. Firstly, the number $p/d$, and therefore the number $b+p/d$, is unlikely to be a whole number for every country, as population sizes don't tend to be as nice as in our example. "You can't give a country, say, 63.3 MEPs," explains Grimmett. "MEPs simply can't be cut up that way. So you need to decide how to round fractions to whole numbers."
Given a number, say 1.75 or 1.25, there are three obvious ways of rounding to a whole number: rounding upwards to the next biggest whole number (this gives 2 for both 1.75 and 1.25), rounding downwards to the next smallest whole number (which gives 1 for both 1.75 and 1.25) and rounding to the nearest whole number (which gives 2 for 1.75 and 1 for 1.25). "We had a long debate about this and given the constraints we had, we decided to give a base of $b=5$ to each state and then round the number $p/d$ upwards to the next biggest whole number," says Grimmett. This means that for every state the number $p/d$, even if it's very small, will get rounded to at least 1, so every state gets at least 6 seats. The committee chose this method of rounding because it's relatively robust: had they chosen to round to the nearest whole number, rather then next biggest one, using a base of 6, then just a small change in the population of a small country like Malta could lead it to gain an extra seat and politicians had agreed that this kind of sensitivity to small changes wasn't desirable.
The second problem is that so far there's no guarantee that the total number of seats comes to 751. This is where the number $d$ comes in. "For whatever number $d$ you start with, you divide the population of each country by $d$ and you round the result to a whole number using your chosen system." explains Grimmett. "This gives you a seat allocation $b+p/d$ for each state. You then add up the total number of seats. Of course you don't generally get 751. But now you can play with $d$, by increasing or decreasing it until you get exactly 751."
Here's a very simple example. Suppose state $A$ has a population of 3,500, state $B$ has a population of 3,501 and state $C$ has a population of 360. If we take $d=10$, the seat allocation is:
State A: $5+3,500/10=355.$
State B: $5+3,501/10=355.1$ which gives 356 after rounding upwards.
State C: $5+360/10=41$.
This gives a total of 752 seats - that's one too many. Now increase $d$ slightly to 10.01. The new seat allocation is:
State A: $5+3,500/10.01=354.65$ which gives 355 after rounding upwards.$
State B: $5+3,501/10.01=354.75$ which gives 355 after rounding upwards.
State C: $5+360/10.01=40.964$ which gives 41 after rounding upwards.
The total number is now exactly 751 seats.
Here is a plot of the number of seats against population size for the recommended system:
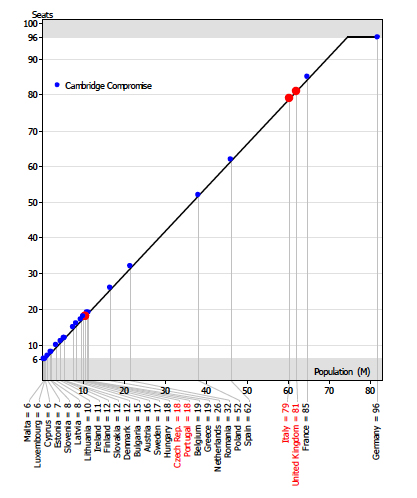
A plot of the number of seats against population size for the recommended system. Image: Victoriano Ramirez Gonzalez.
The plot shows a straight line pointing upwards, which then turns into a horizontal line when the population size becomes big enough for the cap to kick in and proportionality is lost. From a mathematical view point there are nicer solutions, which give a smooth curve and preserve proportionality all the way through. This could have been achieved, for example, by raising the population size to some power $q$, so that a country with a population of $p$ gets $b+Ap^q$ seats, where $q$ is some number less than 1 and $A$ is a constant. "But the difficulty with power functions is that they are quite hard to communicate," says Grimmett. "Linearity leads to a loss of proportionality at the top, but we regarded the linearity over the vast range of states to be an enormously attractive property as it is very transparent. Also, if the European Parliament one day decided to change the cap of 96, then the graph could become even simpler and nicer to look at than it is at the moment."
So how are MEPs likely to respond to the Cambridge proposal? "Given the constraints, I think this is about as transparent a system as we could have proposed," says Grimmett. "But there are losers and gainers." Mid-range countries with populations of between 7 and 12 million could lose up to four seats each, while larger countries including France, UK, Italy, and Spain would increase their representation. Germany is the only country affected by the cap. If the system is to be adopted it needs to be approved by all Member States. So we may well see another round of heavy discussion before bartering for seats becomes a thing of the past.
Further reading
You can read the full report of the committee here.