Monitoring the monitors
This is the era of performance monitoring. Data on practically every aspect of public services are gathered, analysed and published in the name of higher standards and accountability. A bewildering array of targets are set, and vast sums are spent on measuring who hits and who misses. The consequences of a miss can be very serious: when it comes to hospital budgets, the difference between two stars and three can be more than a million pounds.
But is this deluge of data really improving standards? The Royal Statistical Society has doubts. It has just published a report on performance monitoring in the public services, setting out what it sees as the dangers of poor design, implementation and interpretation. According to the authors, every aspect of performance monitoring, from designing performance indicators to reporting the results, is in need of improvement.
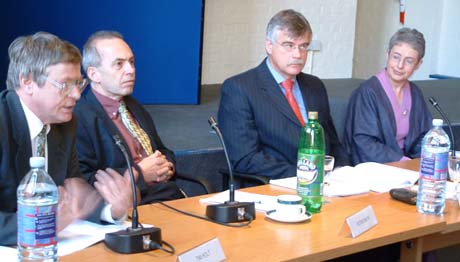
At the press conference announcing publication of the report.
From left to right: Tim Holt, Peter Smith, Andy Grieve (President of the Royal Statistical Society) and Sheila Bird (Chair of the Performance Indicators Working Group)
Let's start with the design. A poorly chosen indicator can be worse than no indicator at all, because it can encourage behaviour designed to lead to a high rating rather than to genuine improvement in the service being provided. Asked to name a single performance indicator she would like to see scrapped, the report's lead author, Professor Sheila Bird, gives a depressing example. Apparently, prisons are expected to reach targets for reducing illegal drug use by inmates - but no distinction is made between hard and soft drugs. So, perversely, a prison with a smaller number of heroin addicts is deemed to be performing better than a prison with a larger number of cannabis users. Since heroin users tend to be harder cases than cannabis users, this means that a policy of leaving heroin users alone and going after cannabis users would result in a better "performance" - surely not the intended consequence.
And then there's implementation. Poorly collected data can give meaningless or misleading results. The process of data collection can be intrusive and cause resentment and loss of staff morale. Neither is it cheap, and since any money that's spent on measuring performance has been diverted from spending to improve performance, data collection needs to be done well to justify the expenditure.
Finally, reporting on performance indicators is not a straightforward matter. Large amounts of data are often rolled up into a single "rating" or headline figure - a practice criticised in the report - and this headline figure is then reported without any reference to the constituent statistics. Also, any attempt to measure performance is bound to involve uncertainty, and this uncertainty is a very important part of the results. The authors call on journalists to "insist on access to and reporting of the measure of uncertainty that qualifies each rating" when reporting on league tables or star ratings. "If you don't know the uncertainty you cannot know whether there are real effects," says Sheila Bird. In essence, she believes the pubic are "being misled" by simplified headline figures.
School league tables come in for specific criticism from the report's authors, who point out that England is the only country which still employs this sort of crude ranking system to monitor the performance of schools. They say that the general public are well up to the challenge of evaluating high-quality data for themselves. According to one of the report's co-authors, Harvey Goldstein, parents are unlikely to make their judgment solely on the headline ranking, if they are talked through different aspects of a school's performance. "You should publish the whole truth," he says, "warts and all".
Properly set up and implemented, performance monitoring offers the public the chance to keep tabs on how their money is being spent, and to demand improvement when services aren't up to scratch. But we mustn't be passive consumers of numerical data - it's up to us to monitor the monitors and see that they're doing their jobs properly.