The growth rate of COVID-19
Why isn't R enough?
See here for all our coverage of the COVID-19 pandemic.
We have all become used to thinking about R, the reproduction ratio (or sometimes called the reproduction number) of a disease. That's the number of people infected, on average, by a single infected person. As we saw in previous articles, R helps us understand what is happening with the disease: R>1 means that the epidemic will grow, R=1 means we are plateauing, R1 means that the epidemic will decline.
(Note that the R we hear about on the news each day changes over the course of the epidemic, it is the effective reproduction number rather than the basic reproduction number, R0, that you might also have heard of – you can find out more about the difference between them here.)
One thing that R does not tell us, though, is how quickly things are changing. This is because R is not a rate, there is no timescale involved. For example, if R=2 for some disease then we know the epidemic will grow (because R>1), but we cannot tell how quickly. For diseases like HIV or TB, where there can be months or years between one person infecting the next person, even R=2 means slow growth over time. However for influenza or measles, where the infection is much faster, on the scale of days, R=2 means very rapid growth.
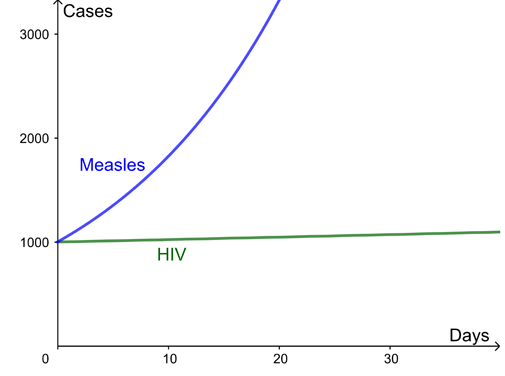
Here are two example curves for the growth of infection, both with a reproduction ratio R=2. The difference is the time between new infections – several months for HIV but just days for measles.
What is the growth rate of an epidemic?
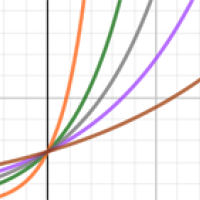
The growth rate of a disease is a natural way to capture how quickly the number of infections are changing day by day. The growth of cases of a disease is modelled using an exponential curve: $$ N(t) = {\rm constant} \times e^{\lambda t} $$ Here $N$ is the number of cases, which depends on time $t$ measured in days, and $\lambda$ (pronounced "lambda") is what is called the growth rate of the disease per day. (The number $e$ is a mathematical constant approximately equal to 2.719 and intimately connected to exponential growth.)
For the example curves above, the growth rate for HIV is $\lambda$=0.002 per day and for measles is $\lambda$=0.06 per day. This leads to wildly different outcomes over the next month despite both diseases in this example having the same reproduction ratio. You can use the interactivity below to explore how the progression of a diseases changes for different growth rates (use the slider to change the value of $\lambda$).
During the COVID-19 pandemic the number of new cases, and new deaths, is reported each day – we watched in horror as these increased in the UK in March and early April, and have now seen them decrease over recent weeks. If the growth rate is positive, the number of new cases each day is increasing, if the growth rate is 0, the number of new cases stays constant. What is needed to keep the epidemic under control is for the growth rate to be negative and hence the number of new cases to be decreasing. If the number of new cases has decreased by 3% since yesterday, then the growth rate is, approximately, $\lambda$ = -0.03 per day. (This isn't exactly equivalent but a good approximation for typical values of $\lambda $. The growth rate actually works like compound interest which you can read about here.)
Conversely, for small values of $\lambda$ (eg $\lambda=0.01$), the value of lambda approximates the percentage growth in cases per day: $\lambda=0.01$ means that cases will increase by around 1\% a day. However, for larger values of lambda (eg $\lambda=0.35$) this approximation is no longer accurate. In this case the percentage growth from one day to the next is $e^\lambda-1$ (eg for $\lambda=0.35$ that's $0.42$). (For a more detailed explanation of the relationship between the growth rate and the percentage growth per day read How to work out doubling time.)
Which is better: R or the growth rate?
Both the reproduction ratio $R$, and the growth rate, $\lambda$, are valid measures for understanding the growth of a disease. They each have their uses, as outlined below:
| Reproduction ratio: R | Growth rate per day: $\lambda$ |
|---|---|
|
R is more natural for understanding strength of intervention needed to stop an epidemic, better for planning control measures. For example:
|
Growth rate is more natural for thinking about how cases change over time. For example
|
|
R>1 exponential growth R=1 flat R1 exponential decay |
$\lambda >0$ exponential growth |
| R a ratio of cases by infection generation. It is not a rate: there is no timescale involved. | The growth rate $\lambda$ is a rate, usually given in days for COVID-19. |
| R is not at all easy to measure in practice, but can be fitted using models if the timescales of infection are known. In principle it could be estimated by detailed epidemiological data on exactly who got infection from whom, but this is not usually feasible in typical settings. | The growth rate $\lambda$ is relatively easy to estimate from time series data of cases or deaths (but see below about small numbers). A simple approach is just to find the gradient of the logged cases. More advanced approaches, which can take into account a time-varying growth rate, or heterogeneous population, again involve fitting epidemic models. |
Both the reproduction ratio and the growth rate are particularly hard to estimate when the number of cases is small, for example if the incidence of the disease is very low, or if the community you are studying has a very small population. In that case, day to day fluctuations can easily swamp the underlying patterns of the disease, so you will have greater uncertainty about the growth rate (and so expect wider confidence intervals).
How do you get from R to the growth rate and vice versa?
The precise relationship between R and the growth rate is not straightforward: it needs to take into account the timings of each infection to the next. A crude approximation is
$$R=e^{\lambda T},$$ where $T$ is the mean generation time: the time from one infection to the next.I can cope with some advanced maths, tell me more!
OK! All of this supposes that the control measures and number of people susceptible to the disease are not changing too quickly.
Following one infected person, denote their time since infection by $\tau$ (in days). They go on to infect $R$ others on average. For each of these, their timing of infection is distributed with probability density function $f(\tau)$. Then (exercise for maths undergraduates!) $R$ and $\lambda$ are related as follows: $$R^{-1} = \int_{\tau=0}^ {\infty} e^{-\lambda \tau} f({\tau}) d\tau$$ and yes, this is very closely related to a Laplace transform, or a moment generating function for the generation time distribution. For specific distributions for the generation time, for example a gamma distribution, this can sometimes be simplified. Taking the generation time to be exactly constant, say $T$, we recover the $R = e^ {\lambda T}$, but this is a rather crude approximation for many infectious diseases in practice. Note, $f(\tau)$ depends on a variety of things, including biological things like the incubation period, and on social factors like whether you still mix with others when you have symptoms or if you self-isolate.See this paper by Wallinga and Lipsitch for more details.
About this article
Rachel Thomas and Marianne Freiberger are the Editors of Plus. This article was produced with Julia Gog, Professor of Mathematical Biology at the University of Cambridge, as part of our collaboration with JUNIPER, the Joint UNIversity Pandemic and Epidemic Response modelling consortium. JUNIPER comprises academics from the universities of Cambridge, Warwick, Bristol, Exeter, Oxford, Manchester, and Lancaster, who are using a range of mathematical and statistical techniques to address pressing question about the control of COVID-19. You can see more content produced with JUNIPER here.
Gog is also a member of SPI-M, a modelling group which feeds its results into the Scientific Advisory Group for Emergencies (SAGE), and of the steering committee of a national consortium, led by the Royal Society, to deal with the COVID-19 pandemic.

Comments
DanielD
I would be really grateful if you could you write an article covering the "dispersion parameter k", I have read about it but I haven't been able to find how is mathematically defined or used, thanks
John Horsfall
Very interesting. I always thought lambda was strictly appropriate only in a difference equation, which \[ N(t) = {\rm constant} \times e^{\lambda t} \] is clearly not, so that this equation should really contain 'r' and that 'r' should be the instantaneous rate of increase and not a rate over a finite time period. You (or I) learn something every day.
Susan Mitchell
1. Why are growth rates not calculated to tenths of a percentage? It makes a big difference to any growth rate near zero in terms of halving and doubling times.
2. Why aren't the government also giving halving and double times for the lower and upper figures of the range? They are much easier to understand than percentages and give an idea of expected rises and drops in daily numbers of new cases of Covid-19?
Why are we being told the range but not the median growth rate? The median, is after all the statisticians' best guess for how the daily numbers are going to go up or down.
Charlie S
I am trying to calculate this rate atm - but I find it ridiculous that I can’t find it anywhere.
The comment of the media often is that it would take around 120 years for the corona virus to spread to all the (current!) population- but that is for linear growth and there is nothing linear about virus spread. I really don’t understand this reasoning, and I am by no means an expert mathematician.
Susan Mitchell
In order to make sense of growth rates we need halving times (the time in days taken for current daily numbers of new coronavirus cases to half) for negative growth rates and doubling times (the time taken in days for current daily numbers of new coronavirus cases to double) for positive growth rates.
This would make more sense to the general public than growth rate percentages and the general public could then better predict what might happen to daily numbers of new Covid-19 cases in the future. This would allow us all to hold government to account because we could tell whether the government's predictions are correct.
However, there is a problem. The government figures for growth rates are only given to the nearest percent. This is problematic because doubling and halving times increase markedly near a growth rate of zero (and where R=1). We need to have growth rates to a precision of at least a tenth of a percent. Otherwise at anywhere near a growth rate of zero or an R of 1 the figures given are useless. At whole numbers of percents we cannot calculate a halving time or doubling time of more than 68 days (2 months). The next stop is infinity.
If we are given growth rates to the nearest tenth of a percent we can calculate a halving or doubling time of up to 690 days (2 years).
The difference is extremely important because we not only need to know whether growth rates and R numbers are above or below zero and 1, respectively. We also need to know whether they are actually or effectively zero or 1. If this is the case then the daily numbers will stay the same for the foreseeable future.
This has huge ramifications. If the halving (or doubling) time is two years we won't notice much of a drop (or rise) in the next few months. Hospitals will still have the same number of coronavirus cases to deal with every day and other medical interventions and cancer testing will continue to stay on hold. If the halving (or doubling) time is even longer then, in the absence of good quality track and trace or a vaccine, the only thing that will save us is herd immunity.
Redmond Hanlon
As an arithmetic idiot, could I ask: since the R value is an average, does it not disguise the fact that some people are transmitting to the many whilst most are transmitting to few, if any?
Jonathan Wang
That's a good point and question. R is typically reported with 95% credible intervals which helps to quantify the uncertainty and variability associated with the R calculation.
Anonymous
In the following article R=rxT+1 is used as an approximation for R. For rxT >1, The result is quite lower than the formula used here. https://royalsociety.org/-/media/policy/projects/set-c/set-covid-19-R-e…
Grace Beveridge
I have limited understanding of this paper, however is there a target/desirable R number for Covid-19?
ilovegermany
I am tracking Germany's numbers I use this formula for rate of growth over 7 days
=(((day7-day1)*100)/day1)/10
My reasoning to wanting to calculate the R
I could also just do it daily but I think over 7 days is better, I think the incidence level concept is flawed, because trending in Germany really is over 3 day or 4 days, but Sunday-Tues are almost nothing because of less reporting on the weekends. So you see the trend over 3 days about the same spike 3-4 days then low 3 days, repeat sometimes the spikes grow a little each week, so you can measure the curve. Also the if you change 7 day to 14 days the incidence level is twice as high but at 3 days it is two times lower, and this is more consistent to what is really going on. Then take into consideration percent of population that has cases it very low, thankfully. In my city over 138,000 we have only 3% of the city who had it, and this does not grow fast. Add to this that quick testing (not so reliable) adds to the number of cases, but Germany stopped measuring reproduction ratio R and Growth rate is important.
So using your data above,
how would I calculate R(reproduction ratio) ? In simple terms, (I use Excel)
and how to calculate your growth rate formula above ?
Thanks
ilovegermany
I put the spreadsheet here for you to download https://1drv.ms/x/s!AuvJc68dQC9sgR1LGFy2RR8avRfK?e=RqyRuH
I track the data in the DATA and DATA PLUS sheets
I created two new sheets RATES and FORECAST
In the RATES sheet I have trouble calculating the exponential growth rate and also the
R reproduction number
I hope that my FORECAST sheet can be completed
and some CHARTS on a CHART sheet
Griffin
In the equation what is the Constant equal too and how do I find out?
Dr AJAN M J
In fact i do have the same query. How can we calculate the constant on the formula for R?
Chris Edwards
I think there is a problem with the encoding/processing of less-than signs in this article, resulting in missing regions of text (tested with Firefox and Vivaldi browsers).
Rachel
Thanks for letting us know. We've hopefully fixed this now - please let us know if there's still a problem.