How to measure a million
You're sweating in the spotlights and squirming in your chair as the whole nation is watching you. One more question. Four possible answers. If you get it right, you're a millionaire. If not, you go home with a mere £32,000. Should you go for it? Or pack up and settle for what you've got?
If you've ever watched the TV game show Who Wants To Be A Millionaire?, you've probably imagined what it's like sitting on that chair. Would you go all the way or play it safe? If you'd opt for the latter, then, according to a recent study, you're with the majority.

Roger Hartley of Manchester University, Gauthier Lanot of Queen's University, Belfast, and Ian Walker of Warwick University used a mathematical model to analyse the data of 515 past contestants of the game show, and found that roughly two thirds of them decided to quit while they were ahead. Only one third dropped out because they got a question wrong, and a mere three went on to win the million.
But why would economists be interested in this? The answer is that the show can help understand people's attitude towards taking risks, and this is increasingly important in modern society. The financial markets rise and fall with investors' willingness to back projects despite uncertainty, and insurance companies operate on people's willingness to pay to reduce future risk. A nation's health and health service depend on people's attitude to things like smoking and binge drinking, and governments' decisions on risky projects, such as reforming the education system or going to war, depend on how the public is likely to assess these risks.
Who Wants To Be A Millionaire? lends itself perfectly to such a study. The show is all about deciding whether or not to take a gamble. Its rules are straightforward and the candidates know exactly how much they stand to win or lose at each stage. Also, if they don't drop out, they get rich quite quickly in this game, so researchers can see if their willingness to take risks changes with wealth.
The theory the researchers used goes back to John von Neumann and Oskar Morgenstern's work of the 1940s. Von Neumann and Morgenstern realised that to model something as subjective as perception of risk, you have to measure not the real, objective value of things - money or goods - but the relative value of these things to an individual. This value is called the utility.
Let's look at an example: suppose I flip a coin and you win £1000 if heads comes up, and lose £1000 if tails comes up. You have a 50:50 chance of winning. If you like a bit of a gamble you might accept this, but if you're more cautious, then the risk of losing £1000 may be unacceptable to you. You may feel that the potential gain of £1000 is simply not worth as much as the £1000 you already have. To persuade you to accept my gamble I might have to offer you a potential gain of, say, £10,000. You would then accept the gamble if the risk of losing the £1000 you already have means less to you than the possibility of winning £10,000.
Economists model this subjective value of money or goods by a utility function. A simple example of this is the function $u(x) = A x^b$, where $x$ is your wealth, and $A$ and $b$ are some fixed numbers.
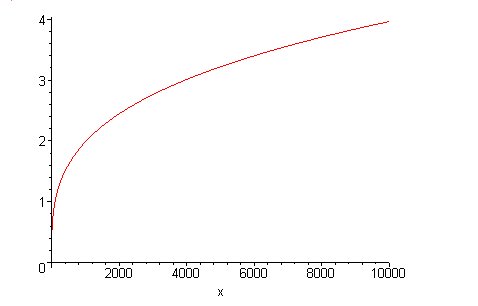
The figure shows the graph of the function with $A = 0.25 $ and $b = 0.3$. If $b$ is less than one, then the slope of the function decreases with your wealth $x$ - the function becomes flatter as $x$ gets larger. As your wealth increases, the utility, or subjective value, of it increases more and more slowly. In our example, £1000 has utility $0.25 \times 1000^{0.3} = 1.985820587$. To find an amount that has twice that utility value, we have to go all the way up to 10,080.
This means that you are "risk-averse": the difference of £9080 between the £1000 and the £10,080, to you is only worth as much as the initial £1000. You're only prepared to take a risk on your £1000 if the potential gain is a lot more. The number $b$ is a measure for your risk averseness: the smaller it is, the flatter the curve, and the greater the amount I'd have to offer you before you're prepared to accept.
This is an example of an "expected utility model". The fact that $b$, the number measuring risk averseness, doesn't change with $x$ is a special feature of this particular utility function, and it's a feature that also turns up in Hartley, Lanot and Walker's model.
Maybe you are finding it hard to believe that this relatively simple mathematical function supposedly measures such a complex and subjective phenomenon. You wouldn't be alone with your criticism: some scientists think that the expected utility model, especially when the number corresponding to $b$ is constant, is far too crude to truly reflect people's behaviour.
But in the Millionaire study the model performs remarkably well. The contestants behave pretty much like the theory predicts. The model says that the overall risk averseness is quite high, not surprisingly, as most people seem to prefer to play safe.
The researchers also think that the behaviour of the Millionaire contestants to some extent reflects that of society as a whole. This seems a little strange at first, since everyone in the sample stands out from the general public because of the very fact that they want to appear on the show, and also because an overwhelming majority of the contestants are male. But answers to 791 questionnaires that had been sent out to people who had been selected to be on the show (but may not have passed the first round), showed that their answers to risk-related questions were pretty much the same as those collected in more general surveys, like the Labour Force Surveys.
In short, this study confirms what many people already believed: that as a society we are averse to risk. It may not be glamorous, but it seems that most of us prefer to play it safe.