Maths in a minute: Homotopy
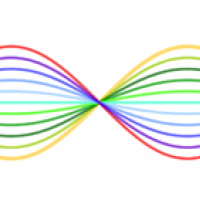
The concept of homotopy captures the idea that, sometimes, two shapes can be deformed into each other without doing anything drastic, like cutting them up or lifting them out of their surroundings. As an example, look at the yellow and the red curves in the GeoGebra applet below. They form two different types of S-shapes, but it's easy to imagine deforming one into the other. If you don't believe it, use the slider.
This applet illustrates how two curves in the plane can be continuously deformed into each other.
How can you make this intuition precise? First note that a curve can be thought of as a piece of straight line that has been arranged in the plane in a particular way, by bending it, or perhaps stretching or squeezing it. This means that there's a mathematical function which assigns to each point on the piece of straight line the corresponding point in the resulting curve. The function is continuous, which means that there are no gaps in the curve.
Given our two curves in our example above, let's write $f$ for the function that gives the red curve and $g$ for the function that gives the yellow curve.
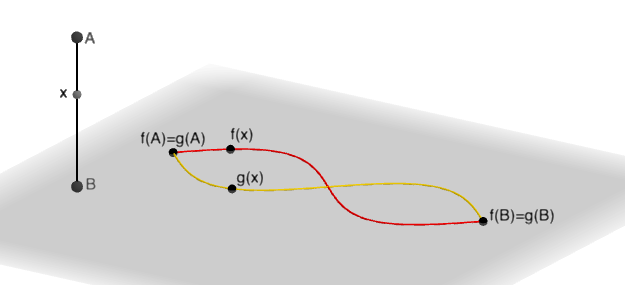
You can think of each curve as coming from taking the straight line shown on the left and arranging it in the plane in a particular way. This gives continuous functions from the piece of straight line to the plane. The functions take the end points A and B of the straight line segment to the end points of the two curves. A point x inside the straight line segment is taken by the functions to a point along each of the two curves.
Now deform the yellow curve in the applet below into the red one by using the slider. If you stop this process at some point you will see a third, dashed curved, which is somewhere along the way between the original two. It corresponds to a particular value of the variable $t$ shown in the slider.
Using the slider you can deform the curves. If you stop at some point you see a third, dashed curve.
This third in-between curve can also be defined in terms of a continuous function from our straight line segment to the plane. Since the curve is associated to the variable $t$, let's call this function $H_t.$ We can do this for every possible value of $t$, so we end up with an entire family of functions each defining a curve. When $t=0$ the corresponding curve is the original yellow one, so $H_0=g.$ When $t=1$ the corresponding curve is the red one, so we have $H_1=f.$ The family of functions $H_t,$ for $t$ between $0$ and $1$, therefore captures the deformation of one curve into another. To pin down the concept of homotopy we also want to capture the fact that this deformation is continuous, that is that there are no sudden jumps as we deform the curves. To make sure of this, let's fix a point $x$ on the straight line segment on which the functions are defined. The function $g=H_0$ takes it to the point $g(x)=H_0(x)$ on the yellow curve. The function $f=H_1$ takes it to the point $f(x)=H_1(x)$ on the red curve. Each function $H_t$ in between takes it to a point $H_t(x)$ on an intermediate curve. If we now vary $t$ keeping track of our point, then its journey should be continuous: without jumps or gaps. In other words, if we fix an $x$ and treat the family $H_t(x)$ as a function of $t$, then this function should be continuous as $t$ varies. This should be true for all $x$.
If you fix a point x on the line segment on which the functions Ht are defined and vary t, you see that the points Ht(x) trace out a continuous journey without jumps or gaps.
If the family $H_t$ of functions satisfies all the things we have just mentioned, then it is said to be a homotopy between the functions $f$ and $g.$ We can generalise this notion. Rather than looking at curves on the plane, which come from functions from a piece of straight line to the plane, we can look at functions between any type of topological spaces $X$ and $Y$. Let's assume $f:X \rightarrow Y $ and $g:X \rightarrow Y $ are two such functions and that they are continuous.
A homotopy between the two functions $f$ and $g$ is a family of continuous functions $H_t:X \rightarrow Y$ for $0\leq t \leq 1$ so that
- $H_0=g$
- $H_1=f$
- For all points $x$ in $X$, if we treat $H_t(x)$ as a function of $t$, then $H_t(x)$ is continuous.
The concept of homotopy divides the set of continuous functions from $X$ to $Y$ into equivalence classes: two functions are considered equivalent if there is a homotopy between them. Going back to our example, we see that all curves in the plane are equivalent in this sense because they can all be deformed into each other. On the surface of a donut, however, not all curves are equivalent because one curve could from a closed loop that winds around the donut's hole while the other forms a closed loop that doesn't wind around the hole. To deform one into the other you'd have to cut.
To see why this difference is important, see Maths in a minute: Topology and Maths in a minute: The fundamental group.
About this article
This article was produced as part of our collaboration with the Isaac Newton Institute for Mathematical Sciences (INI) – you can find all the content from the collaboration here.
The INI is an international research centre and our neighbour here on the University of Cambridge's maths campus. It attracts leading mathematical scientists from all over the world, and is open to all. Visit www.newton.ac.uk to find out more.