
Maths in a minute: The central limit theorem
The central idea in statistics is that you can say something about a whole population by looking at a smaller sample. Without this idea there wouldn't be opinion polls or election forecasts, there would be no way of testing new medical drugs, or the safety of bridges, etc, etc. It's the central limit theorem that is to a large extent responsible for the fact that we can do all these things and get a grip on the uncertainties involved.

What's the average weight in the population?
To see how the theorem works, imagine that you want to know the average weight of the population in the UK. You go out and measure the weight of, say, 100 people whom you've randomly chosen and work out the average for this group — call this the sample average. Now the sample average is supposed to give you a good idea of the nation's average. But what if you happened to pick only big people for your sample, or only very skinny ones?
To get an idea of how representative your average is likely to be, you need to know something about how the average weight of 100-people-samples varies over the population: if you took lots and lots of samples of size 100 and worked out the average weight for each, then how variable would this set of numbers be? And what would its average (the average of averages) be compared to the true average weight in the population?
For example, suppose you know that if you took lots and lots of 100- people-samples and wrote down the average weight of each sample, you'd get all values from 10kg to 300kg in equal proportion. Then this would tell you that your method of estimating the overall average by taking one sample of a 100 people isn't a very good one, because there's too much variability — you're just as likely to get any of the possible values, and you don't know which one is closest to the true average weight in the population.
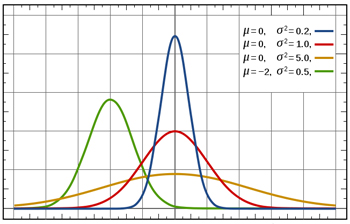
Various examples of the normal distribution, with different means and variances.
So how can we say anything about the distribution of 100-people-averages — called the sampling distribution — when we don't know anything about the distribution of weight across the population? This is where the central limit theorem comes in: it says that for a big enough sample your sampling distribution is approximated by a normal distribution — this is the distribution with the famous bell shape. (A convention is that a sample size of 30 is good enough.)
The mean of this normal distribution (the average of averages corresponding to the tip of the bell) is the same as the mean in the population (the average weight of the population). The variance of this normal distribution, that is how much it varies about the mean (indicated by the width of the bell), depends on the sample size: the larger the sample, the smaller the variance. There's an equation which gives the exact relationship.
So if your sample size is big enough (100 would certainly do since it's bigger than 30), then the relatively small variance of the normal sampling distribution means that the average weight you observe is close to the mean of that normal distribution (since the bell is quite narrow). And since the mean of that normal distribution is equal to the true average weight across the population, your observed average is a good approximation of the true average.
You can make all this precise, for example you can say exactly how confident you are that the true average is within a certain distance of your sample average, and you can also use the result to calculate how large a sample you need to get an estimate of a given accuracy. You can also calculate the probabilities needed to perform hypothesis tests based on a random sample from a population even when you don't know anything about the underlying probability distribution. It's the central limit theorem that lends precision to the art of statistical inference, and it's also behind the fact that the normal distribution is so ubiquitous.
The central limit theorem is actually a bit more general than we've let on here. For a precise statement, see here.
Comments
Anonymous
The sampling distribution, i.e. the distribution of the means of the individual samples is NOT the normal distribution, as this blog states. The sampling distribution is the so-called Student t distribution, which, although similar in shape to the normal (Gaussian) (bell-shaped) has different parameters. In particular, normal distribution does not depend on the sample size while the Student t distribution does (sample size / degrees of freedom is a parameter of Student t). The spread of normal is characterized by variance (standard deviation squared) while the spread of Student t is characterized by the standard error squared.
Anonymous
A nice article, clearly written but...
"There's an equation which gives the exact relationship." Yes indeed. So why not say what it is? This is supposed to be a Maths page isn't it?