Outer space: Venn you can't use Venn
The Reverend John Venn was Master of Caius College, Cambridge and the inventor of a machine for bowling cricket balls, but it is for neither of these distinctions that his name is (almost) a household word. In 1880 he created a handy diagram to help him teach and explain logical possibilities. So useful did these pictures turn out to be that in time they became known as Venn diagrams thanks to Clarence Irving Lewis, who introduced the name in 1918.
Venn's diagrams are familiar in all sorts of contexts. We see them in schoolbooks, newspapers and magazines, and the TV news. They make things clear by representing a collection of possibilities by a region of space. Here is a simple example that represents all the possibilities where there are two attributes.
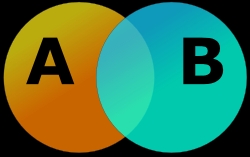
Image reproduced under the GNU free documentation license.
Suppose the gold circle A represents the collection of all ginger animals and the blue circle B the collection of all cats. The overlap region of A and B represents cats that are ginger; the region of A not intersected by B represents all the ginger animals other than cats, while the region of B not intersected by A includes all the cats that aren't ginger; finally, the black region outside A and B represents all things, like ladybirds, that are neither ginger animals nor cats.
These diagrams are widely used to display all the different sets of possibilities that can exist. It is easy to think that they are as harmless as handwriting. Yet, one must take care when using them. They are constrained by the "logic" of the two-dimensional page on which they are drawn. Suppose we represent four different sets by the circles A, B, C and D. They represent the four different sets of friendships between three people that can exist among four people: Alex, Bob, Chris and Dave. The region A represents mutual friendships between Bob, Chris and Dave; region B friendships between Alex, Chris and Dave; region C friendships between Alex, Bob and Dave; and region D friendships between Alex, Bob and Chris. The way the Venn-like diagram has been drawn displays a sub region where A, B, C and D all intersect. This would mean that the overlap region contains someone who is a member of A, B, C, and D. But there is no such person.