
Where are England footballers born?
With the UEFA men's Championships now in full swing we ask an important question: which part of England can claim the bragging rights for producing the most England international football players?
England players

Which part of England produces the best players? This photo show Marcus Rashford (born in Manchester) playing for England against Belgium at the 2018 FIFA World Cup. Photo: Кирилл Венедиктов, CC BY-SA 3.0.
| Region | No. of England players* |
| East | 25 |
| East Midlands | 25 |
| London | 89 |
| North East | 39 |
| North West | 89 |
| South East | 30 |
| South West | 11 |
| West Midlands | 36 |
| Yorkshire and Humber | 33 |
| Outside of England | 16 |
| Total | 393 |
We can see that 393 men born after 1945 played for England. The joint highest contributors were London and the North West, each producing 89 England players. Interestingly, more men played for England who were born outside England (16), than those who were born in the South West (11).
However, these figures don't tell the whole story. Some regions have larger populations than others so have a greater opportunity for producing international players. This should be taken into account.
Births in regions
We can obtain the number of boys born in each region by filtering the databases produced by the Office for National Statistics. (Unfortunately, the relevant data only go back to 1991 but nevertheless we can use this to help estimate the relative birth rates in the different regions).
Then, for each year, for each region, we can calculate
$$\mbox{\% of boys born in that region} = 100 \times \frac{\mbox{no. of boys born in that region}}{\mbox{total no. of boys born in England}}.$$The most recent birth of someone who has played for England was 2003, so calculations are only needed up until that point.
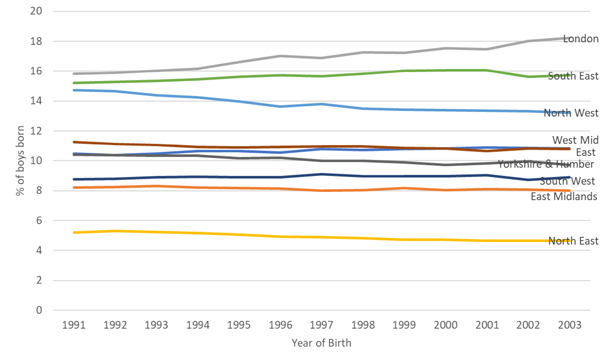
Percentage of boys born according to region of England from 1991-2003.
We can see that the relative birth rates in the regions remained reasonably steady over the period 1991-2003. (Actually, London did appear to be on a slight upward trend during that period and the North West on a slight downward trend, but for ease of calculation let's assume that these changes are ironed out pre-1991). Hence, we can obtain an approximation for a constant to represent each region's relative birth rate:
$$\mbox{Relative birth rate} =100 \times \frac{\mbox{total no.of boys born in the region 1991 to 2003}}{\mbox{total no.of boys born in England 1991 to 2003}}.$$| No. of boys born 1991-2003 | Relative birth rate (%) | |
| East | 429739 | 10.7 |
| East Midlands | 327719 | 8.1 |
| London | 680739 | 16.9 |
| North East | 198287 | 4.9 |
| North West | 557567 | 13.8 |
| South East | 630397 | 15.6 |
| South West | 358761 | 8.9 |
| West Midlands | 440201 | 10.9 |
| Yorkshire and Humber | 406114 | 10.1 |
| Total | 4029524 | 100 |
So, of boys born in England during 1991-2003, 16.9% were born in London but only 4.9% were born in the North East. We should incorporate this variation into our quest to find the most proliferate England player-producing region.
England player density
By dividing the number of England players born in the region by the relative birth rates in each region, we can obtain a fair measure of each region's ability to produce an England player. Let's call this measure the region's England player density.
$$\mbox{England player density} = \frac{\mbox{No. of England players}}{\mbox{Relative birth rate}}.$$| No. of England players | Relative birth rate | England player density | |
| East | 25 | 10.7 | 2.34 |
| East Midlands | 25 | 8.1 | 3.07 |
| London | 89 | 16.9 | 5.27 |
| North East | 39 | 4.9 | 7.93 |
| North West | 89 | 13.8 | 6.43 |
| South East | 30 | 15.6 | 1.92 |
| South West | 11 | 8.9 | 1.24 |
| West Midlands | 36 | 10.9 | 3.30 |
| Yorkshire and Humber | 33 | 10.1 | 3.27 |
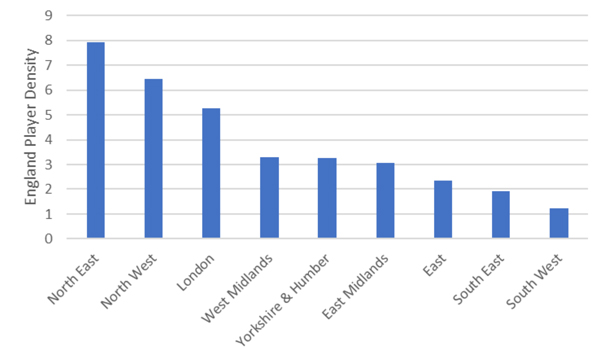
We can see that the North East has the highest England player density and so could lay claim to being the region most likely to produce an England international player, whereas the South West takes the wooden spoon.
So if you currently live in Cornwall and are planning to bet on a future son playing for England, you might be tempted to move to, say Newcastle. However it is worth remembering that only 393 boys born after 1945 went on to play for England. The total number of boys born in England between 1946 and 2003 was approximately 20 million! Hence, upping sticks 500 miles across the country might be considered a little rash in this scenario.
About the author

Slim Khan is a Senior Teaching Fellow at the University of Warwick, and is particularly interested in mathematics and statistics related to games and sports.