Computing the Mandelbrot set

"The Mandelbrot Set is the most complex object in mathematics, its admirers like to say. An eternity would not be enough time to see it all, its disks studded with prickly thorns, its spirals and filaments curling outward and around, bearing bulbous molecules that hang, infinitely variegated, like grapes on God's personal vine."
[James Gleick, "Chaos: Making a New Science"]
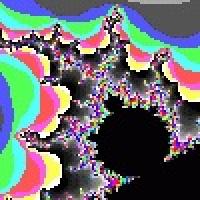
Almost everyone reading this article has no doubt encountered pictures from the Mandelbrot Set, like the one above. Their appeal is not limited to the mathematician, and their breathtaking beauty has found its way onto posters, T-shirts and computers everywhere. Yet what is a fractal? How do these dusty old maths equations create such pretty pictures? If you look in most library books on fractals and chaos, you'll soon find the pretty pictures on the cover give way to talk of iterations, complex numbers and mapping $z \rightarrow z^2 + c$.
This article will show exactly what your computer does. If you have some skill at programming, you will find this article very helpful. But don't worry if you aren't a programmer, all my code examples are well commented and you should be able to figure them out. I have also included a few links to source code and a fully compiled program. More on that later.
Background
Benoit B. Mandelbrot, born in Poland in 1924, started experimenting with Julia sets in the late 1970s, and placed great pressure on the computers of the time, demanding more memory, more power to clean up the grainy images that appeared on the monitor screen. Back then computers were very primitive, and drawing pretty fractals would have taken a lot more effort! These days even humble old PCs can easily do better.
The algorithm for defining the Set is really quite simple. I am assuming here that the reader is at least partly familiar with complex numbers. If this is not the case, try back issues of PASS Maths or your local library.
- Let $c$ be a complex constant, defined according to the position on screen.
- Let $z_0 = 0$ be our first complex iteration.
- Iterate once by letting $z_n = z_{n-1}^2 + c$.
- Repeat step 3 until one of the following occurs:
- (a) The modulus (length) of $z_n$ exceeds a given value. This is our test for divergence.
- (b) The number of iterations exceeds a given value. This is how we assume convergence.
- Draw the point with colour determined by the number of iterations. Often the convergent points are drawn in black.
If all this talk of convergent and divergent iterations is making your head spin, don't worry! All will be explained later.
A Few Programming Notes
All my example code is in Turbo Pascal, since although I am learning to code in C, I don't know enough yet to draw pretty graphics. I'd best explain a few peculiarities of the language for those unfamiliar.
Firstly, I have placed plenty of comments to explain what goes on. These are the bits of text in {squiggly brackets}. In C you would use /* this notation */ for the same effect. Comments are not important and can be omitted in your own programs, but it is good practice to explain your programs for both others and yourself, much later, when you want to come back to them.
Secondly, the variable type real is just Pascal's version of C's float. I could have opted for singles or doubles, both of which are faster, but they would have required compiler directives and I'm trying to keep the program as simple to follow as possible. Any other obscure commands will be explained in the program.
I apologise for the video mode I have used in this program. I wanted to use a graphics mode that had at least 256 colours, but since SVGA modes are a headache and a half to access in Turbo Pascal I have used a mode with rather "chunky" pixels. This is mainly to keep the program from getting too complicated. I hope I have succeeded!
The Mandelbrot Set Drawer
If you haven't already done so, download and look at the source code for mbrot1.pas. This is a simple first program to introduce you to the basics before we get into complicated matters like "zooming in" on interesting details. The {commented} bits of the program are rather self-explanatory, but even so I will now explain what the program does.
The first interesting part of the program is the list of variables (after the word var for non-Pascal programmers). Many of these values are never changed throughout the program, such as limit, cx and cy. Why did I use them?
There are two reasons. The first is that this way, if you follow the same method in your own program you can experiment with exploring the Mandelbrot Set by simply changing these starting values. The variables cx and cy are the centre of our viewpoint. The scale value is how much we are "zoomed in" by - if you make this value smaller it will bring you "closer" to the Set, make it bigger and you will "zoom out".
The second reason for using variables instead of constant values is that later on we will look at an improved version of the program, with a limited zoom ability. In other words, they are for expansion.
Now look down to the section that starts with repeat and ends with the until (...) statement. This is the main loop of the program, and each pass through it the equation $z \rightarrow z^2 + c$ is iterated once. Each time the until (...) statement checks to see if it has either converged or diverged.
Some people may be wondering why I use such a complicated expression to check for divergence. As a demonstration, consider the source code for mbrot1a.pas. In this version, I used the simpler expression abs(a1) + abs(b1) to check for divergence. The effect is shown below:
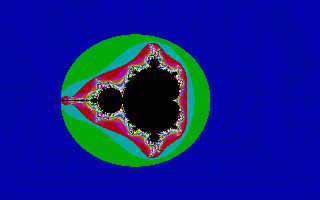
An Ordinary Mandelbrot Set.
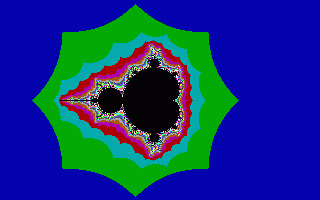
The effect of "cheating" on the maths!
But How Do We Zoom In?
The thing about the Mandelbrot Set that enthrals even non-mathematicians is that the more you zoom in on the image, the more beautiful the images become, and yet the same pattern seems to emerge. Our program so far isn't that useful - if we want to explore we have to half-guess the new starting conditions and recompile the entire program. Next I will show a basic system of zooming in. Once you have the idea I have no doubt that you could improve upon it! To keep our program as simple as possible, zooming is very basic. If you haven't done so yet, download the source code for source code for mbrot2.pas.
This is an identical program to the previous version, but has had several new procedures added to provide a primitive zooming facility. When the Set has finished drawing, press Q to quit or the spacebar to bring up a crosshair. Move the crosshair left with Z, right with X, up with K and down with M, and when you have chosen the point to look closer at, press the spacebar again and the zoom doubles! As the zoom level increases the time needed to redraw can get longer, so be patient. If you haven't got access to a programming language, the compiled versions of all three source codes are included and will run under DOS or Windows. I can't guarantee results for anything else, but if demand is great I'll try to write a C version, which should be pretty universal!
There are three main areas of note in this program. Firstly, notice the getpix function. It is not important for you to understand it, simply know that it returns the colour of a pixel at the given screen co-ordinate.
This is used for the second item of interest. Notice the section of code
    j:=getpix(x,y+i) xor 255;
    pixel(x,y+i,j);
in the draw_cross procedure. The xor statement is an "exclusive or", and is used to perform bit comparisons. It compares each pair of bits in the numbers and returns 1 if they are different, and 0 if they are the same. The curious effect of this statement, since 255 is made entirely of 1s in binary, is that taking a number xor 255 will "switch" all the bits in the number. And if we do this again, we get the original colour back. This trick is used simply so that moving the crosshair doesn't destroy the picture underneath!
The third item to consider is the keyboard routine. Why did I use letter keys instead of the arrow keys? The simple answer is that arrow keys are special functions and need to be treated with more care. Letters are simpler to code in, and as I keep stressing, I'm trying to keep this code as simple as possible!
So how does this bigger program work? Most of the new procedures are simply for drawing and moving the crosshair, and reading in the user's keypresses. The main zoom is just three lines in the select_point procedure:
    cx:=cx+scale*(xcross-160);
    cy:=cy+scale*(ycross-100);
    scale:=scale/2;
The first two lines change the centre of our window onto the Set. The third line halves the scale, which means our main routine squeezes twice as much detail into the same size screen - in effect, doubling the zoom level!
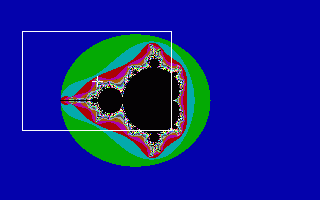
Example of Zoom
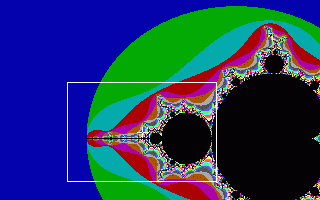
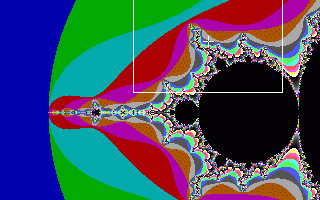
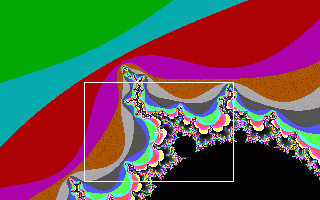
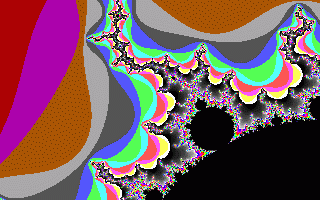
This series of pictures demonstrates a simple delve into the Mandelbrot Set with my program! These were obtained by running the program under Windows 95 and using the PrintScrn button. The white rectangle shows where the next zoom is centred (the crosshair is in the centre of the rectangle).
Improvements to Program - An Exercise for the Reader!
This program is far from perfect. However, I hope you now have some idea of how the basic algorithms work, and can write your own programs to use them. Here are a few suggestions for you to consider:
The examples here use a rather primitive graphics mode, so I could get plenty of colours whilst avoiding messy encounters with SVGA. The assembly language procedures needed to draw anything with it are a rather unfortunate side effect. With these days of Windows programming and Direct X, most of the hassle of using graphics in programs is neatly removed. You should be able to write much better, more accurate programs with far less effort!
I avoided changing the colours used by my program because things like palette changes would only make the program more complicated. However, feel free to change the colours in your own Mandelbrot Set programs.
The user interface is quite horrible. I could have used a mouse, or at least the arrow keys on the keyboard, but I avoided this because it would have meant more difficult code to study. Mouse routines are not standard in Turbo Pascal and need more dipping into assembly, for example. I would be quite disappointed if your programs used an interface like this one! Some suggestions for improvements include allowing different zoom levels, changing the accuracy required and displaying some kind of menu or button system.
The program is also quite slow. I mentioned earlier that I could have used singles or doubles instead of real variables, but I avoided this because it requires using compiler directives in the program. If you know about numerical coprocessors and the like, feel free to change this (the speed increase is about three-fold!) and if you are writing in another programming language this may not be a problem for you.
Recommended Reading
- Chaos by James Gleick, Minerva, 1996.
Related Sites
- The Mandelbrot Set
- Interactive viewer for the Mandelbrot set for readers with a Java-compatible browser.
- Mandelbrot images
- Some dramatic images from the Mandelbrot set by Andy Burbanks, interviewed in our The art of numbers in Issue 8 and author of our feature article Extracting beauty from chaos in this issue.
About the author
Andrew Williams is an undergraduate student taking a BSc in Mathematics at the University of Sussex.
Comments
Paul Fitzsimons
Thank you Andrew for this elegant and easy way to plot the Mandelbrot set. I easily converted this to quick basic and, coincidently, I also used a 320 x 200 Screen with 256 colors, so it worked fine with no major alterations to the algorithm. Happy computing!