icon

50 visions of mathematics - Brillouin zones

Share this page
Brillouin zones

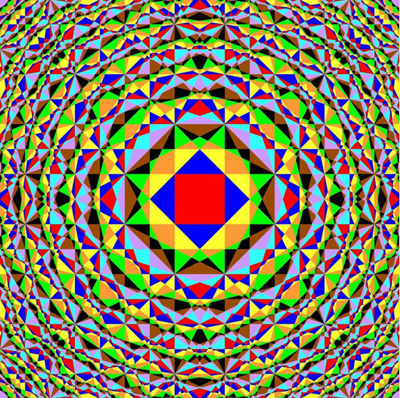
Image produced by R.R. Hogan, University of Cambridge.

This pretty picture looks like something you'd see through a kaleidoscope, but it's more than a bit of fun. It's an image of a two-dimensional crystal — but not as you would see it if you looked at it. Instead, it shows the Brillouin zones of the crystal, which give important information about how waves, such as light or X-rays, pass through it.

The picture, created by R.R. Hogan, is one of the images that appear in the book 50 visions of mathematics, which celebrates the 50th anniversary of the Institute of Mathematics and its Applications.

To find out more about crystals and what can happen when you bombard them with waves, read Shattering crystal symmetries.

Read more about...
  • Want facts and want them fast? Our Maths in a minute series explores key mathematical concepts in just a few words.

  • What do chocolate and mayonnaise have in common? It's maths! Find out how in this podcast featuring engineer Valerie Pinfield.

  • Is it possible to write unique music with the limited quantity of notes and chords available? We ask musician Oli Freke!

  • How can maths help to understand the Southern Ocean, a vital component of the Earth's climate system?

  • Was the mathematical modelling projecting the course of the pandemic too pessimistic, or were the projections justified? Matt Keeling tells our colleagues from SBIDER about the COVID models that fed into public policy.

  • PhD student Daniel Kreuter tells us about his work on the BloodCounts! project, which uses maths to make optimal use of the billions of blood tests performed every year around the globe.